

The inventory turnover ratio measures how many times a business sells and replaces its stock over a set period. The formula is straightforward: Inventory Turnover = COGS ÷ Average Inventory, where Average Inventory = (Beginning Inventory + Ending Inventory) ÷ 2. In practice, if your cost of goods sold and your average inventory are such that your turnover is 6, meaning you cycled through your stock six times that year.
- Formula: Inventory Turnover = COGS ÷ Average Inventory
- Average Inventory = (Beginning Inventory + Ending Inventory) ÷ 2
- Quick example: COGS divided by Average Inventory equals a turnover of about 6 times
Table of Contents
- What does the inventory turnover ratio actually tell you?
- How do you calculate inventory turnover step by step?
- Worked examples: retail, restaurant, and durable goods
- How do you convert turnover into days on hand?
- Is your turnover ratio good? Industry benchmarks explained
- What does high or low turnover actually indicate?
- How to improve your inventory turnover ratio
- Common mistakes and limitations to watch for
- A hospitality example: reading turns in a busy café
- Key Takeaways
- Why inventory turnover is the metric I keep coming back to
- Useful sources and where to find benchmark data
What does the inventory turnover ratio actually tell you?
The ratio tells you how fast your stock moves, and that single number carries a lot of business weight. According to Investopedia, it measures how many times a business sells and replaces its inventory during a set period, making it one of the clearest signals of sales velocity and operational efficiency you can pull from your financials.
Here is what a healthy read on the ratio reveals:
- Sales strength: Fast turns mean products are moving. Slow turns suggest weak demand or poor product-market fit.
- Cash tied up in stock: Every dollar sitting in unsold inventory is a dollar not paying wages, rent, or suppliers.
- Freshness and obsolescence risk: High-perishable operations need high turns. Low turns in a café or restaurant mean food spoiling before it sells.
- Supply-chain responsiveness: A sudden drop in turns can signal a supplier problem, a demand shift, or a purchasing decision that missed the mark.
Track the ratio monthly or quarterly rather than just annually. Trend analysis reveals far more than a single snapshot: a rising trend signals growing demand or tighter purchasing discipline, while a falling trend is an early warning worth investigating before it hits your margins. Pair inventory turnover with complementary metrics like asset turnover and inventory-to-revenue ratios for a fuller picture of working-capital efficiency.
A high turnover ratio reduces holding costs and storage expenses, but push it too high and you risk stockouts and lost sales. The goal is not the highest possible number. It is the right number for your operation.
Pro Tip: If you manage multiple locations, calculate turnover separately for each site. A blended group average can mask one location running dangerously lean while another sits on dead stock.
How do you calculate inventory turnover step by step?
Getting the calculation right depends on using the correct inputs. Here is what each term means and where to find it.

Defining COGS and average inventory
Cost of Goods Sold (COGS) is the direct cost of producing or purchasing the goods you sold during the period. You find it on your income statement. It includes raw materials, ingredients, and direct labor tied to production, but not overhead like rent or marketing.
Average Inventory smooths out the distortion of measuring stock at a single point in time. Use the formula: (Beginning Inventory + Ending Inventory) ÷ 2. For a business with strong seasonality, a simple two-point average can mislead. Corporate Finance Institute recommends calculating monthly or quarterly averages instead, then averaging those figures across the year for a truer operational picture.
Why COGS beats sales in this formula
Using sales revenue instead of COGS inflates the turnover number because sales include your markup. COGS measures the actual cost velocity of your stock, which is what you want. If COGS genuinely is not available (for example, in early-stage reporting), you can substitute net sales, but flag it clearly and treat the result as directional only.
Step-by-step calculation
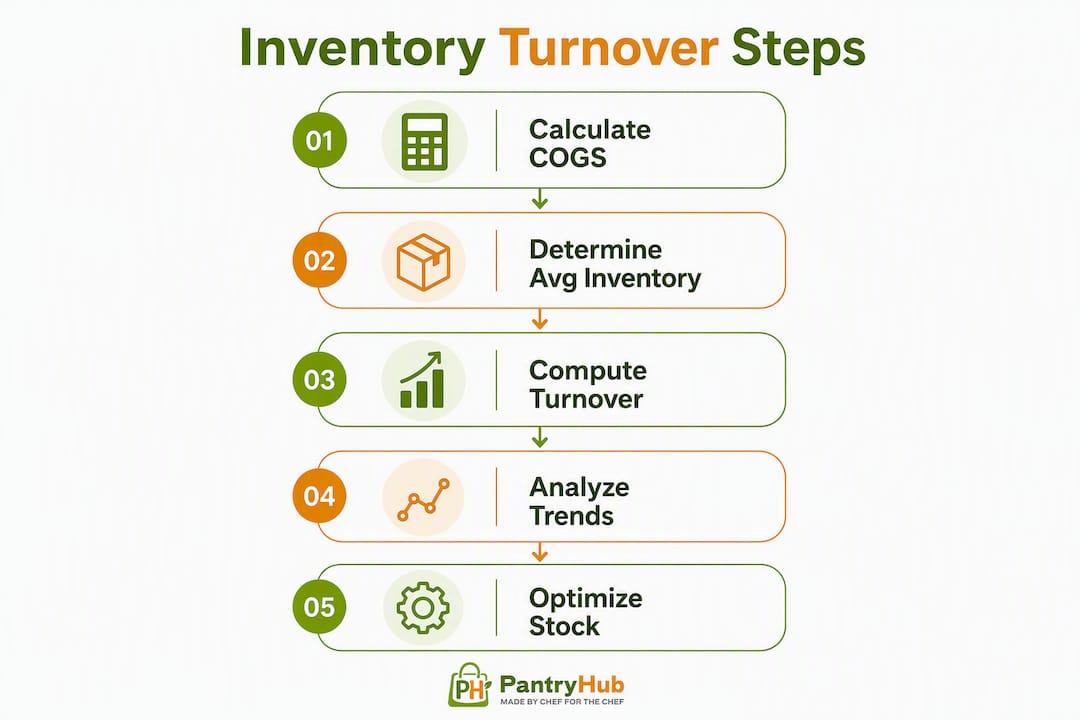
- Pull your COGS from your income statement for the period (annual, quarterly, or monthly).
- Find your beginning inventory value from the balance sheet at the start of the period.
- Find your ending inventory value from the balance sheet at the end of the period.
- Calculate Average Inventory: (Beginning + Ending) ÷ 2.
- Divide COGS by Average Inventory to get your turnover ratio.
- For seasonal businesses, repeat steps 2–4 for each month, then average those monthly figures before dividing into COGS.
Pro Tip: Pull figures from the same accounting period. Mixing a full-year COGS with a single month's ending inventory is one of the most common errors managers make, and it produces a ratio that is meaningless for decision-making. Daily stock tracking makes this much easier to get right.
Worked examples: retail, restaurant, and durable goods
Three short examples show how the same formula produces very different results, and why context matters when you interpret them.
Example 1: Retail clothing store
- Annual COGS with beginning and ending inventory values yields an inventory turnover around 5 times
Interpretation: A mid-range apparel retailer turning stock roughly five times a year is operating within a typical range for that category. Not alarming, but worth monitoring for seasonal dips.
Example 2: Busy café (perishable goods)
- Monthly COGS with beginning and ending inventory values can produce a relatively high turnover per month, which translates to a much higher annualized turnover
Interpretation: For fresh produce, dairy, and proteins, high monthly turns are expected and healthy. The risk here is not slow stock, it is running out mid-service. Reorder cadence and par levels need to be tight.
Example 3: Specialty equipment dealer
- Annual COGS with beginning and ending inventory balances produces a turnover ratio a bit above 1
Interpretation: Heavy or specialty equipment turns slowly by nature. A ratio under 2x is common in this category. The concern is not the number itself but whether specific SKUs have not moved at all, tying up capital with no near-term sale in sight.
How do you convert turnover into days on hand?
The turnover ratio is useful, but many operators find "days on hand" easier to act on. NetSuite describes this metric as Days Inventory Outstanding (DIO), calculated as:

DIO = 365 ÷ Inventory Turnover (for annual figures)
For monthly periods, substitute the number of days in the month for 365.
Inventory turnover can be translated roughly to days on hand, with lower turnover indicating longer inventory times. For example, a turnover around 2 corresponds to nearly half a year of stock, while much higher turnovers correspond to shorter stock durations appropriate for perishable goods.
Days on hand maps directly to reorder planning. If your DIO is 30 days and your supplier lead time is 10 days, you need to reorder when you have roughly 10–14 days of stock remaining. It also feeds into the cash conversion cycle: shorter DIO means cash returns faster from inventory investment.
Is your turnover ratio good? Industry benchmarks explained
There is no single "good" number. AccountingTools is clear on this: acceptable values depend entirely on the industry and product type, and performance should be evaluated against your own history and same-industry peers.
Here are directional ranges to orient your thinking:
| Industry | Typical Turnover Range | Notes |
|---|---|---|
| Grocery / fresh food | 20x–30x+ annually | Perishability drives high turns |
| Fast-casual / restaurant | 50x (monthly basis) | Ingredient-level turns vary by item |
| Apparel / fashion retail | 4x–6x | Seasonal markdowns affect averages |
| Consumer electronics | 5x–10x | Product cycles shorten holding periods |
| Auto parts / hardware | 2x–4x | Slower-moving, higher-margin items |
| Heavy equipment | 1x–2x | Capital-intensive, long sales cycles |
A few important caveats:
- Compare within your category. A grocery chain's 25x turnover is not a benchmark for a wine retailer running at 3x. Both can be healthy.
- Your own trend matters most. A ratio dropping from 8x to 5x over three quarters is a stronger signal than a static 5x with no context.
- Use public filings for peer data. SEC 10-K filings from publicly traded competitors in your category show real COGS and inventory figures you can use to build a peer benchmark.
- Trade associations and industry reports often publish category-level benchmarks. The National Restaurant Association, for example, publishes operational data relevant to food-service operators.
What does high or low turnover actually indicate?
The number alone does not tell you what to do. You need to diagnose the cause.
High turnover: usually good, sometimes a warning
Strong demand, disciplined purchasing, and just-in-time (JIT) replenishment all drive high turns. But Investopedia cautions that a very high ratio can also mean inventory levels are too low, increasing stockout risk and lost sales. A sudden spike in turnover deserves a second look: it could reflect surging demand, or it could mean a supplier shortage left you with less stock than you needed.
Low turnover: usually a problem, sometimes intentional
Corporate Finance Institute links low turnover to overstocking, poor demand forecasting, or obsolete and expiring stock that ties up cash. Common root causes include:
- Overordering based on optimistic sales projections
- SKUs that no longer sell but remain on the books
- Pricing that is out of step with the market
- Long supplier lead times that force large safety stock purchases
- Weak promotional activity on slow-moving lines
Diagnostic checklist
Before acting on a low or high ratio, check these data points:
- Age-of-stock report: Which SKUs have not moved in 30, 60, or 90 days?
- Stockout frequency: Are you running out of fast movers before the next order arrives?
- Lead time changes: Has a supplier extended delivery windows, forcing larger buffer stock?
- Product-level turns: The category average can hide one item dragging the whole number down.
Common inventory mistakes like overstocking and poor SKU management are often the first place to look when turns fall unexpectedly.
How to improve your inventory turnover ratio
Improvement starts with the highest-leverage actions, not the easiest ones.
- Sharpen your demand forecasting. Historical sales data, seasonal patterns, and upcoming promotions should all feed your purchase orders. Gut-feel ordering is the fastest route to overstock.
- Rationalize your SKU list. Identify the bottom 20% of SKUs by sales volume and margin. Discontinue or consolidate them. A menu that is too long creates inventory complexity without proportional revenue.
- Run targeted promotions on slow movers. Move stale stock before it becomes a write-off. Margin-preserving promotion tactics can shift slow inventory without training customers to expect discounts.
- Negotiate supplier lead times. Shorter lead times let you carry less safety stock. Even shaving two days off a delivery window can reduce average inventory meaningfully.
- Review safety stock levels. Safety stock should reflect actual demand variability and lead-time risk, not a fixed "just in case" buffer that never gets touched.
- Adopt a real-time inventory system. Digital stock management reduces counting errors, supports accurate averaging, and surfaces slow movers before they become a cash problem.
30-day improvement checklist
- Week 1: Pull a full age-of-stock report. Flag anything over 45 days with no movement.
- Week 2: Review your bottom 20% SKUs by sales. Decide: discount, return to supplier, or discontinue.
- Week 3: Audit your last three purchase orders against actual usage. Identify consistent overorders.
- Week 4: Set reorder points based on DIO and supplier lead time. Test the new par levels for one full ordering cycle.
Pro Tip: Do not chase a higher turnover number at the cost of service levels. Running too lean causes stockouts, which damage customer experience and revenue faster than slow stock damages margins. Balancing turnover with availability is the real management skill.
Common mistakes and limitations to watch for
Even a correctly calculated ratio can mislead if the inputs or context are wrong.
- Using sales instead of COGS. Sales include your markup, so the ratio looks better than it is. Always use COGS for an accurate read.
- Using a single ending inventory figure for a seasonal business. A retailer with $50,000 in stock on January 1 and $200,000 on December 31 will get a distorted average. Use monthly closing figures averaged across the year.
- Ignoring shrinkage and spoilage. If your COGS does not account for waste, your inventory figure is overstated and your turnover understated. Adjust for known shrinkage before calculating.
- Failing to adjust for returns. Returned goods that re-enter inventory inflate your average inventory without representing sellable stock.
- Treating one period's result as definitive. A single quarter's ratio is almost meaningless without trend context. Track it across at least four periods before drawing conclusions.
On valuation: the inventory accounting method you use (FIFO, LIFO, or weighted average) affects both your COGS and your ending inventory value, which changes the ratio. Use a consistent method period over period, and note the method when comparing with peers who may use a different approach.
The strongest protection against all of these errors is consistency: same method, same period definition, same data sources, every time you calculate.
A hospitality example: reading turns in a busy café
Here is how a café manager might run this calculation on a Monday morning.
The scenario: A café's monthly COGS and inventory values produce a turnover ratio above 5 times for the month, with days on hand close to six
Interpretation: The café is cycling through its stock roughly every six days. For fresh ingredients, that is healthy. But six days of stock on hand means a supplier delay or an unexpected busy weekend could cause a shortfall. Reorder points need to account for that margin.
Immediate operational actions:
- Track turnover at the ingredient level, not just the category level. Dairy and proteins may turn in 3 days; dry goods in 14.
- Run a weekly dead-stock review. Any ingredient unused for seven days in a fresh kitchen is a waste risk.
- Standardize portion sizes through recipe cards. Inconsistent portioning distorts actual usage and makes forecasting unreliable.
- Use low-stock alerts to trigger reorders before you hit zero, not after.
- Review your supplier delivery schedule against your DIO. If turns are 5x monthly and your supplier delivers twice a week, your order quantities may be larger than necessary.
- Ingredient-level stock tracking gives you the granularity to act on these numbers rather than guess.
Single-shift validation checklist:
- Count three high-velocity ingredients (e.g., eggs, milk, chicken) and compare to your par levels.
- Check your last supplier invoice against actual usage for the same period.
- Identify one ingredient that has not moved in five days. Decide: use it in a special, return it, or adjust the order quantity.
Inventory accuracy directly supports profitability, and the turnover ratio is the fastest way to see whether your kitchen is running tight or carrying dead weight.
Key Takeaways
The inventory turnover ratio is most useful as a trend metric: a single result tells you where you are, but a series of results tells you where you are heading.
| Point | Details |
|---|---|
| Core formula | Inventory Turnover = COGS ÷ Average Inventory; use COGS, not sales revenue. |
| Convert to days | Divide 365 by your turnover to get Days on Hand; use it to set reorder points. |
| "Good" varies by industry | Perishables turn 20x–30x+ annually; heavy equipment may turn 1x–2x; compare within your category. |
| High turnover has a downside | Excessively high turns increase stockout risk; balance turnover against service levels. |
| Track trends, not snapshots | A ratio dropping across three consecutive quarters signals a problem worth investigating. |
Why inventory turnover is the metric I keep coming back to
Most financial ratios feel abstract until something goes wrong. Inventory turnover is different. It connects directly to decisions you make every week: what to order, how much to carry, which products to push, and which to cut.
What surprises many operators is how much the conversion to days on hand changes the conversation. A turnover of 4x sounds fine in the abstract. Ninety-one days of stock on hand sounds alarming, and it should. That framing makes the metric actionable in a way that a ratio alone rarely does.
The other thing worth saying plainly: a high turnover ratio is not always a win. Operators who chase the number without watching stockout rates and service levels often find they have traded one problem for another. The ratio is a signal, not a target. Use it alongside age-of-stock reports and gross-margin data, and you will have a genuinely useful operational tool rather than a number that looks good on a dashboard.
Pantryhub is built around exactly this kind of operational clarity, giving hospitality teams real-time stock visibility so the numbers you calculate are the numbers you can trust.
Useful sources and where to find benchmark data
For further reading and benchmark research, these are the most reliable starting points:
- Investopedia: Inventory Turnover Ratio — clear definition, formula, and worked examples with context on high vs. low interpretation.
- Corporate Finance Institute — detailed calculation walkthrough, seasonal averaging guidance, and complementary metrics.
- AccountingTools: Inventory Turnover — practical notes on COGS vs. sales, valuation methods, and common errors.
- NetSuite: Inventory Turnover Ratio — strong on the DIO conversion and operational use cases for reorder planning.
- Wikipedia: Inventory Turnover — useful for terminology (stock turns, merchandise turnover, stockturn) and the accounting context.
Where to find industry benchmarks:
- SEC EDGAR (10-K filings): Search public competitors in your category. Their COGS and inventory figures are disclosed annually and give you real peer data.
- Trade associations: The National Restaurant Association, the Food Marketing Institute, and category-specific groups publish operational benchmarks for members.
- Industry reports: IBISWorld and similar research services provide sector-level financial ratios, including turnover ranges by NAICS code.
- Subscription benchmarking platforms: Services like BizMiner and RMA Annual Statement Studies aggregate financial ratios by industry and company size.

Running a restaurant, café, or bar and want to see your actual turnover numbers without the spreadsheet headache? Pantryhub's hospitality inventory platform tracks stock in real time, calculates your food costs automatically, and surfaces slow movers before they become write-offs. Start your free trial and see what your turns actually look like.