

Manual stocktaking fails restaurants because human error, infrequent counts, and process gaps make shelf counts unreliable and far too slow to act on. By the time a monthly stocktake surfaces a variance, you've already lost the margin. Industry benchmarks consistently show inventory shrink eroding 2–5% of gross profit in food-service operations, and most of that loss traces back to waste and portioning gaps.
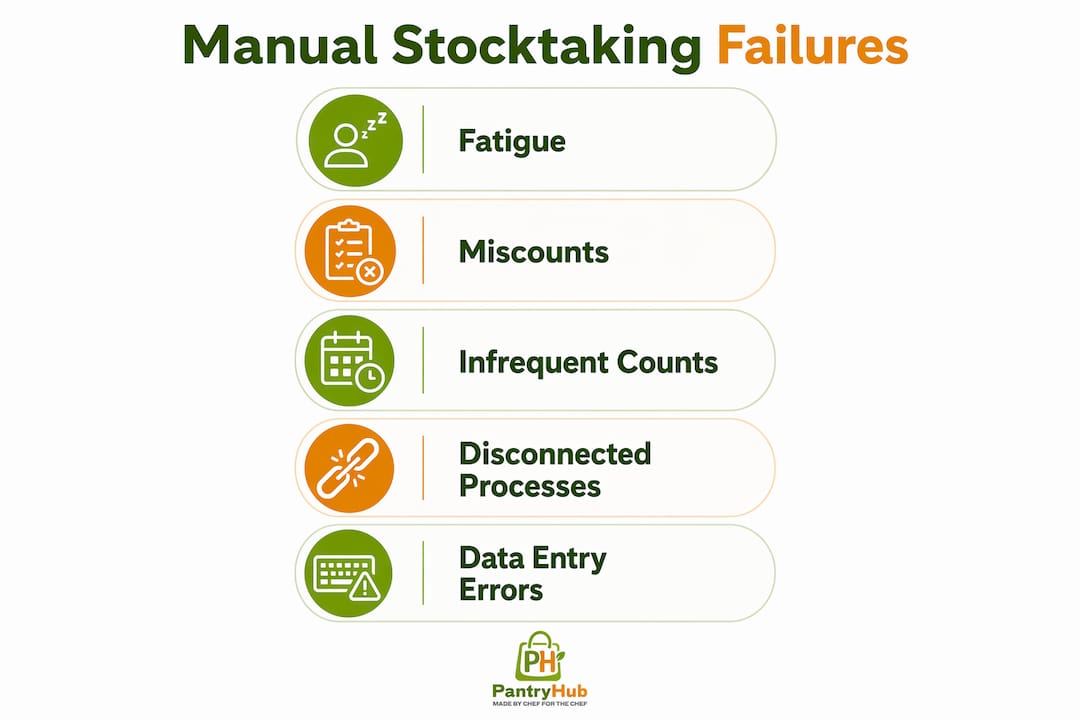
- Human error and fatigue during counts, especially at end-of-shift
- Infrequent counting cycles that let small variances compound for weeks
- Unit-conversion mismatches between how stock is ordered and how it's counted
- Untracked waste, spoilage, and comps that never make it into the record
- POS theoretical depletion that assumes perfect portioning and misses every real-world deviation
These aren't random bad luck. They're structural. And each one has a fix.
Table of Contents
- How inaccurate inventory damages your profit, operations, and cash flow
- Seven common errors that make manual stocktakes fail
- How to measure and calculate inventory risk
- Why cycle counting and other partial fixes help — but only so far
- How integrated inventory software stops manual stocktaking failures
- A practical 30/60/90-day plan to stop inventory errors
- Why POS depletion alone isn't enough — and why layered counting works
- Real examples of manual stocktaking failures and what fixed them
- How to transition from manual to automated inventory management
- Why human factors drive most manual stocktaking failures
- What manual stocktaking actually costs versus automated alternatives
- Key Takeaways
- The discipline comes before the software
- Pantryhub gives you real-time visibility where manual counts leave gaps
- Useful sources for further reading
How inaccurate inventory damages your profit, operations, and cash flow
The financial hit from manual inventory issues isn't a rounding error. When your counts are wrong, your food-cost percentage drifts upward without a clear cause. You over-order because you don't trust the numbers on the shelf, tying up cash in stock you don't need. You under-order because a delivery wasn't logged, and then you 86 a dish mid-service.

Consider a single recurring variance on proteins. If your kitchen is over-portioning salmon by 20 grams per plate across 80 covers a night, that's 1.6 kilograms of unaccounted product daily. At $18 per pound, that's a meaningful monthly loss from one line item, invisible until a stocktake catches it weeks later. Spirits at a bar with free-pours diverge even faster.
The operational ripple effects compound the financial ones:
- Ordering errors from stale count data lead to both stockouts and overstock simultaneously
- Blind reorders based on habit rather than actual par levels inflate your weekly spend
- Supplier friction when emergency orders arrive outside normal schedules
- Audit stress when month-end numbers don't reconcile with purchases
Connected inventory that links POS data, physical counts, and supplier invoices gives operators predictable ordering and measurable cash flow improvement. Manual processes, by design, can't provide that connection.
Seven common errors that make manual stocktakes fail
Understanding the specific failure modes helps you diagnose which ones are hitting your operation hardest. These seven account for the vast majority of stocktaking challenges in restaurants.
-
Fatigue and miscounts. Counting at the end of a double shift produces errors. A staff member who loses their place in a walk-in and restarts a section can double-count an entire shelf. Diagnostic: compare count totals to the prior period — a suspiciously round number (exactly 10 cases) often signals an estimate, not a real count.
-
Unit-conversion mistakes. Ordering in cases, counting in units, and costing in grams creates conversion errors that compound. A case of 6 × 2.5 kg bags counted as "6 units" instead of 15 kg throws your cost calculation immediately. Diagnostic: check whether your count sheet units match your invoice units for every line.
-
Missed delivery and invoice mismatches. A delivery received after hours with no one to verify it gets logged at invoice value, but the actual quantity may differ. Short shipments, substitutions, and damaged goods that aren't noted at receiving create instant phantom stock. Diagnostic: compare your received-goods log to supplier invoices weekly.
-
Double-counting and transposition errors. Paper tally sheets get transferred to a spreadsheet, and a "156" becomes "165." Two people counting the same section without a clear handoff creates duplicates. Diagnostic: run a simple sum check — does your total count value match what your opening stock plus purchases minus theoretical usage should produce?
-
Portioning and recipe drift. Your recipe card says 180g of beef per dish, but the kitchen is plating 210g because the portion scale broke three weeks ago. The POS depletes 180g per sale. The gap is silent and accumulates daily. Diagnostic: weigh five random plates per service for one week and compare to your recipe standard.
-
Unlogged waste, comps, and spoilage. A tray of strawberries goes off and gets binned. A comp goes out to a regular. Neither gets recorded. Unlogged waste and recipe drift typically contribute the largest shares of stocktake variance — larger than theft in most operations. Diagnostic: track how many waste entries your team logs per week. Zero entries almost always means unrecorded losses, not a perfect kitchen.
-
Theft and process leakage. Theft is real, but operators often overestimate its share of variance. When waste and recipe drift are properly logged, theft becomes easier to isolate. Diagnostic: if variance persists after waste and portioning are controlled, investigate access patterns and transaction voids.
Pro Tip: Run a five-minute variance review at the start of each week. Pull the top five highest-variance items from your last count and ask one question for each: was it waste, a portion issue, or a receiving gap? That single habit surfaces the cause faster than any full audit.
How to measure and calculate inventory risk
These four formulas give you a repeatable way to quantify where your operation is leaking. Apply them weekly on your top items, monthly on everything else.
| KPI | Formula | Inputs needed | When to escalate |
|---|---|---|---|
| Variance % | (Theoretical usage − Actual usage) ÷ Theoretical usage × 100 | Opening stock, purchases, closing stock, POS sales | Above 3% on any single item |
| Shrink % | (Opening stock + Purchases − Closing stock − Sales) ÷ (Opening stock + Purchases) × 100 | All stock movements | Above 5% overall |
| Actual vs. theoretical food cost | Actual COGS ÷ Revenue vs. Recipe cost × Covers sold ÷ Revenue | COGS, revenue, recipe costs | Gap wider than 2 percentage points |
| Weeks of cover | Current stock on hand ÷ Average weekly usage | Count data, sales history | Below 0.5 weeks or above 3 weeks |
A quick worked example: Your opening salmon stock is 20 lbs. You received 30 lbs during the week. Your POS says you sold 45 portions at 6 oz each (16.9 lbs theoretical usage). Your closing count is 28 lbs. Actual usage = 20 + 30 − 28 = 22 lbs. Variance = (22 − 16.9) ÷ 16.9 × 100 = 30% variance. That's a five-alarm signal. At that level, investigate portioning and receiving before assuming theft.
For a step-by-step guide to investigating stock discrepancies, the process of tracing variance back to its source is well-documented and repeatable.
Why cycle counting and other partial fixes help — but only so far
Partial fixes are worth implementing. They reduce variance and build discipline. But each one has a ceiling.
- Cycle counting counts a rotating subset of items each day rather than everything at once. It catches issues faster than monthly full counts and reduces the fatigue that causes miscounts.
- Standardized count units eliminate conversion errors by locking count sheets to the same unit as invoices and recipes.
- Receiving checks at the dock catch short shipments and substitutions before they become phantom stock.
- Staff training on count procedures reduces transposition errors and double-counting.
- Spreadsheets are a legitimate first step. They create structure where none existed.
| Fix | Speed of improvement | Accuracy gain | Cost | Sustainability |
|---|---|---|---|---|
| Cycle counting | Fast (1–2 weeks) | Moderate | Low (staff time) | High if maintained |
| POS recipe mapping | Moderate (2–4 weeks) | High for theoretical cost | Low–medium | Medium (recipes drift) |
| Staff training | Slow (4–8 weeks) | Low–moderate | Low–medium | Low without reinforcement |
| Spreadsheets | Fast to start | Low at scale | Low | Low (brittle at scale) |
The ceiling on all of these is the same: they don't connect to each other. A well-trained staff member doing a perfect cycle count still enters the result into a spreadsheet that doesn't talk to your POS, your invoices, or your recipe costs. Spreadsheets become brittle as venues grow — formulas break, prices drift, and one person ends up owning the whole sheet.
Pro Tip: Partial fixes are enough when your variance is below 3% and your operation has fewer than three high-turnover categories. Once you're running multiple protein lines, a bar program, and daily specials, the manual reconciliation load exceeds what any spreadsheet can reliably handle.
How integrated inventory software stops manual stocktaking failures
Software doesn't eliminate human judgment. It eliminates the gaps between human actions where errors accumulate undetected. Here's how specific features map to the failure modes above:

| Failure mode | Software feature that fixes it |
|---|---|
| Fatigue and miscounts | Mobile shelf entry with barcode scanning — count on the floor, not on paper |
| Unit-conversion errors | Locked unit mapping between count, recipe, and invoice |
| Missed deliveries | Invoice reconciliation against purchase orders at receiving |
| Transposition errors | Direct digital entry — no paper-to-spreadsheet transfer |
| Portioning drift | Recipe and portion linking — theoretical vs. actual reconciliation per dish |
| Unlogged waste | Waste logging at the pass, timestamped and categorized |
| Blind reorders | Low-stock alerts triggered by par levels, not habit |
| Supplier friction | Supplier integration for direct ordering from within the platform |
Pantryhub is built specifically for restaurant and hospitality operators who need all of these features in one place. Mobile shelf entry means your team counts on the floor, not on clipboards. Invoice reconciliation catches short shipments the moment a delivery is logged. Recipe integration reconciles your theoretical food cost against actual usage automatically, so you see the gap in real time rather than at month-end. Low-stock alerts fire before you run out, not after. For operators managing multiple locations, Pantryhub gives a consolidated view across every site.
First configuration steps:
- Connect your POS and map your top 30 menu items to their ingredient recipes
- Set par levels for your top 20–30 high-value items
- Enable invoice reconciliation for your primary suppliers
- Train one power user (your head chef or ops manager) to own the weekly variance review
- Run your first weekly top-item count and compare to theoretical usage
A practical 30/60/90-day plan to stop inventory errors
This plan works whether or not you're adopting software. Start with discipline, then layer in tools.
Days 1–30: Establish the baseline
- Identify your top 20–30 highest-cost items (proteins, spirits, specialty produce).
- Create a standardized count sheet with locked units matching your invoices.
- Run your first full-house count on a Monday morning before any deliveries arrive — consistent timing is what makes counts comparable across periods.
- Add a waste log at the pass: one line per waste event, 10 seconds to enter.
- Calculate your baseline variance % for each top item.
Days 31–60: Tighten the process
- Begin weekly counts of your top 20–30 items every Monday morning.
- Reconcile supplier invoices against received goods within 24 hours of each delivery.
- Run a five-minute variance review each Tuesday — identify the top three variances and assign a cause.
- Spot-check five random plate portions per service for your highest-variance protein.
- Review your POS recipe mappings and correct any portion weights that have drifted.
Days 61–90: Automate and sustain
- Evaluate an integrated inventory platform (trial Pantryhub's hospitality inventory software during this window).
- Migrate your count sheets and par levels into the platform.
- Enable low-stock alerts for your top 20 items.
- Run your first month-end full count inside the platform and compare to your manual baseline.
- Set a monthly review of your food cost % against your theoretical cost — make this a standing agenda item.
| Role | Responsibility | Frequency |
|---|---|---|
| Head chef / kitchen manager | Counts top 20–30 items; logs waste at pass | Weekly / daily |
| Ops manager / owner | Reviews variance report; approves reorders | Weekly |
| Receiving staff | Verifies deliveries against POs; logs discrepancies | Per delivery |
| General manager | Reviews food cost % vs. theoretical; escalates anomalies | Monthly |
Why POS depletion alone isn't enough — and why layered counting works
POS-based inventory is a theoretical calculation. It assumes every ingredient leaves the kitchen only as a completed, correctly portioned sale. It doesn't model waste, spoilage, comps, prep yield, or the free-pour at the bar. The gap between POS theoretical depletion and actual stock on hand is exactly where your margin disappears.
Practitioners who count their top 20–30 high-value items weekly — rather than waiting for a monthly full count — typically cover more than half of their total food-cost exposure. That layered rhythm means problems surface while there's still time to act on them, not three weeks after the loss has already occurred.
Pro Tip: During your weekly variance review, sort items by absolute dollar variance, not percentage. A 5% variance on a $40/lb item costs you more than a 20% variance on a $3/lb item. Fix the expensive ones first.
Real examples of manual stocktaking failures and what fixed them
The protein over-portioning spiral. A 60-seat American bistro was running a food cost of 34% against a target of 28%. Monthly stocktakes showed consistent variance on beef and salmon but no obvious cause. When the owner introduced weekly top-item counts and a plate-weight spot-check, the team discovered that portion scales in two stations had drifted by 15–25g per plate. Over 200 covers a weekend, that gap was costing hundreds of dollars in unrecorded product weekly. Fixing the scales and retraining on portion standards brought food cost to 29.5% within six weeks, without any software change.
The bar spirits leak. A neighborhood bar was losing roughly $800 per month in spirits variance. The manager assumed theft. A closer look at the count process revealed that free-pours during busy Friday nights were averaging 1.5 oz instead of the standard 1.25 oz, and that comps were never logged. Once the bar introduced a comp log and switched to jigger pours during peak service, variance dropped by two-thirds. The remaining third was traced to a single staff member who was dismissed after the investigation.
The spreadsheet single point of failure. A multi-site café group was running inventory on a shared Google Sheet owned by one manager. When that manager left, the formulas were broken, the price list was six months out of date, and no one else understood the structure. The group spent three weeks reconstructing count history before adopting a dedicated platform. The lesson: common inventory mistakes like spreadsheet dependency are invisible until the person holding the system walks out the door.
How to transition from manual to automated inventory management
The biggest obstacle to switching isn't the software. It's the belief that the current process, however imperfect, is "good enough." A restaurant losing money even during busy periods is often losing it silently through inventory gaps that manual processes can't surface quickly enough.
Common transition challenges and how to handle them:
Resistance from kitchen staff. Counting has always been "the manager's job." Introducing mobile shelf entry or digital waste logs feels like extra work. The fix is to make the first few counts a team activity, show staff the variance numbers, and connect the data to something they care about — like food quality and not running out of mise en place mid-service.
Data migration. Moving par levels, recipe costs, and supplier lists from spreadsheets into a new platform takes time. Block two to three hours for this, not 20 minutes. Assign one person to own it.
Parallel running. Run your manual count and the new system simultaneously for two to four weeks. The goal isn't to validate the software — it's to build team confidence and catch any setup errors before you rely on the platform alone.
Change management principles that work in hospitality:
- Start with one section (bar or proteins) rather than the whole operation
- Show the team a before/after variance comparison after the first month
- Celebrate when a count catches a real issue — it reinforces that the process works
- Keep the first 30 days low-pressure; accuracy improves as the team builds the habit
The transition from manual to integrated inventory is less a technology project and more a behavior change. The technology makes the behavior easier to sustain.
Why human factors drive most manual stocktaking failures
Motivation and attention are the variables that manual processes can't control. A staff member counting stock at 11 PM after a full service shift is not in the same cognitive state as one counting at 9 AM before a delivery. The financial impact of manual inventory errors is well-documented in research: incorrect counts, incorrect pricing, and untracked waste are the most frequent errors, and they trace directly to the conditions under which counting happens.
Three human factors matter most:
Fatigue. Counting accuracy drops measurably when staff are tired. Scheduling counts for the morning before service, before deliveries arrive, is the single highest-leverage timing change you can make.
Motivation and ownership. When no one owns the count, everyone assumes someone else checked. Assigning a named individual to each count section, with a signature on the count sheet, creates accountability without blame.
Fear of variance. Staff sometimes round numbers or skip items because they're worried about being blamed for a discrepancy. A culture where variance is treated as data, not accusation, produces more accurate counts. When your team knows that a high variance triggers an investigation of the process rather than a finger-pointing session, they count honestly.
The research is consistent: neglecting an efficient inventory control system leaves employees frustrated and contributes to excessive oversights. The fix isn't surveillance. It's structure, timing, and a clear owner for every count.
What manual stocktaking actually costs versus automated alternatives
Manual stocktaking is not free. The labor cost of a full-house count in a mid-size restaurant, done properly, runs two to four hours of staff time per count. At a monthly cadence, that's 24–48 hours of labor per year on counting alone, before you account for the time spent entering data into a spreadsheet, investigating variances, and correcting ordering errors that bad counts created.
The hidden costs are larger:
- Over-ordering from distrust of count data ties up cash in excess stock
- Stockouts from under-ordering cost you in lost sales and emergency supplier runs
- Variance investigation time when month-end numbers don't reconcile
- Food cost drift that goes undetected for weeks between counts
Integrated inventory software typically runs on a monthly subscription. The relevant comparison isn't the subscription cost versus zero. It's the subscription cost versus the labor hours, the over-ordering buffer, and the margin erosion that manual processes produce. For most operations running above $500,000 in annual revenue, the math favors automation. For operators using digital stock management, the reduction in count time and ordering errors alone often covers the platform cost within the first quarter.
Key Takeaways
Manual stocktaking fails restaurants because human error, infrequent counts, and disconnected processes let variance accumulate silently until it has already cost you margin.
| Point | Details |
|---|---|
| Shrink erodes 2–5% GP | Inventory shrink consistently costs restaurants 2–5% of gross profit, mostly from waste and portioning gaps. |
| Count top items weekly | Counting your top 20–30 high-value items weekly covers more than half of food-cost exposure and surfaces leaks fast. |
| Waste logging is high-leverage | A 10-second waste log entry at the pass makes variance reviews productive and reduces accusatory investigations. |
| Partial fixes have a ceiling | Cycle counting, training, and spreadsheets all help but can't connect counts to invoices, recipes, and POS data. |
| Pantryhub closes the gaps | Pantryhub links mobile shelf counts, invoice reconciliation, recipe costing, and low-stock alerts in one platform. |
The discipline comes before the software
Here's an opinion worth sitting with: most restaurants that switch to inventory software without first building counting discipline don't get the results they expected. The software surfaces the variance accurately. But if the team isn't logging waste, isn't verifying deliveries, and isn't doing weekly top-item counts, the platform just shows you a clean dashboard of inaccurate data faster.
The operators who see the biggest improvement are the ones who spent 30 days building the manual habit first. They know what their variance looks like before automation. They've trained their team to count honestly. They've assigned ownership. When the software arrives, it amplifies a process that already works rather than trying to replace one that doesn't.
That said, there's a point where manual discipline hits its ceiling. When you're running multiple proteins, a full bar program, daily specials, and multiple locations, the reconciliation load exceeds what any spreadsheet can handle reliably. That's when integrated software stops being a nice-to-have and becomes the only way to maintain visibility. The 30/60/90 plan above is designed to get you to that point with confidence, not confusion.
Pantryhub gives you real-time visibility where manual counts leave gaps
If your variance reviews are taking longer than your actual counts, that's the signal. Pantryhub is built for restaurant and hospitality operators who need to move from clipboard-and-spreadsheet inventory to a system that connects every moving part.

Here's what the platform does that manual processes can't:
- Mobile shelf entry eliminates paper-to-spreadsheet transcription errors
- AI-powered low-stock alerts fire before you run out, based on your actual par levels
- Supplier integration lets you reorder directly from within the platform
- Invoice reconciliation catches short shipments and substitutions at receiving
- Recipe and portion linking reconciles theoretical vs. actual food cost automatically
- Waste logging at the pass keeps variance reviews focused on causes, not guesswork
Trial checklist: During your first 30 days with Pantryhub, measure three things: your variance % on top items (target: below 3%), your days-of-cover accuracy (target: within 0.5 weeks of actual), and the time your team spends on counts (target: 50% reduction from your manual baseline).
Common onboarding obstacle: getting recipe costs entered accurately takes time upfront. Block a dedicated session with your head chef to map your top 20 dishes before go-live. That investment pays back in the first weekly variance report.
Start your free trial and run your first weekly top-item count inside the platform this week.
Useful sources for further reading
These are the most practical resources for operators who want to go deeper on specific calculations, templates, and case studies.
-
Why Restaurant Inventory Breaks | RestroScout — The clearest explanation of why POS theoretical depletion diverges from reality, with specific examples for bar programs and portioning. Read this if you're trying to explain the gap to your team.
-
Restaurant Inventory Management: Food Cost, Pars & Variance | ProStay — Practitioner-level guidance on layered counting rhythms, par-level calculation, and variance thresholds. Includes templates you can adapt immediately.
-
Why Manual Stock Verification Fails | Inveck — A direct breakdown of the systemic limits of paper and spreadsheet processes, useful for building the case internally for a process change.
-
Why Your Stocktake Won't Match | Brik.ly — The most honest breakdown of variance causes available online, with a clear hierarchy: waste and recipe drift first, theft last. Essential reading before any variance investigation.
-
The Ultimate Guide to Restaurant Inventory Management | NetSuite — Comprehensive operational guidance including count timing, cycle count scheduling, and KPI benchmarks. Use this for building your counting calendar.
-
The Financial Impact of Manual Inventory Record Errors — Academic case study documenting how manual inventory errors translate into P&L damage, balance sheet distortions, and operational friction. Useful if you need to make the financial case to a business partner or investor.