

Stocktake frequency has a direct, measurable effect on food-cost percentage. Moving to weekly or risk-based cycle counts typically closes the gap between theoretical and actual food cost within a few months. If you're running monthly counts only, you're likely absorbing a noticeable percentage point gap between what your recipes say you should spend and what you're actually spending — and you won't know why until the month is already gone.
Here's what the data shows and what to do about it:
- A items (proteins, alcohol, high-cost produce): Count weekly or biweekly. These SKUs carry the most financial exposure and the fastest shrink rate.
- B items (dry goods, dairy, mid-value ingredients): Monthly counts are sufficient for most venues.
- C items (disposables, cleaning supplies, low-cost staples): Quarterly counts keep labor lean without sacrificing control.
- Ultra-perishables and high-volume bars: Daily spot checks on your top 5–10 items prevent overnight losses from compounding.
Weekly cyclic counting reduces inventory shrink by 30–40% in the first 90 days and typically stabilizes actual food cost within 2 percentage points of theoretical by day 120. That's not a marginal improvement — for a restaurant with substantial monthly food sales, closing the variance gap can yield significant monthly savings.
Table of Contents
- What is food-cost variance and why do stocktakes reveal it?
- How counting frequency causally affects food cost
- What stocktake schedule should your venue actually use?
- How to measure the impact of changing your count frequency
- How to run an efficient stocktake without burning out your team
- A worked ROI case: switching A items from monthly to weekly
- Common mistakes that stop frequency from lowering food cost
- Key Takeaways
- The case for weekly counts is stronger than most managers realize
- Pantryhub makes weekly cycle counts practical, not painful
- Useful sources and further reading
What is food-cost variance and why do stocktakes reveal it?
Food-cost variance is the difference between your theoretical food cost (what your recipes and purchase records say you should have used) and your actual food cost (what a physical count shows you actually have left). It's the gap that tells you money is leaving your kitchen without a sale attached to it.
The problem with relying on POS data and invoices alone is that they only capture what was recorded. They miss the staff meal that wasn't logged, the over-portioned steak, the bottle of wine opened for a tasting and never rung in, and the produce that spoiled before it hit a plate. Inaccurate inventory makes food-cost percentages unreliable — variance between theoretical and actual usage usually points back to inventory problems, not recipe math.
A physical stocktake forces a reality check. It surfaces discrepancies that no POS report can catch:
- Waste and spoilage that was never logged
- Portioning errors where staff are consistently over-serving
- Theft — both internal and receiving-side short-shipments
- Receiving errors where you were invoiced for more than you received
- Transcription mistakes in manual inventory records
Each of these hits your P&L differently. Portioning errors inflate your cost of goods sold. Theft creates phantom usage. Spoilage signals a purchasing or storage problem. Without a physical count, you're guessing at which one is driving the number.
How counting frequency causally affects food cost
Frequency isn't just about refreshing data. It changes three things that directly affect your bottom line: how fast you detect a problem, how your team behaves, and how accurately you order.
Detection velocity is the most direct mechanism. A monthly count means a portioning problem or a theft pattern can run for 30 days before you see it. A weekly count cuts that window to 7 days. At a $500/day shrink rate, that's the difference between a $3,500 loss and a $15,000 loss before you even know something is wrong.
Behavioral deterrence is quieter but equally real. When staff know counts happen every week, unrecorded shrink drops. The knowledge that discrepancies will surface quickly changes how people handle product. Regular counts change staff behavior in ways that a monthly audit simply cannot replicate.
Supply-chain feedback closes the loop on ordering. Faster counts give you accurate on-hand figures before you place orders, which means fewer emergency purchases, less over-ordering, and lower carrying costs from excess stock sitting in your walk-in. The flow looks like this:
- Count → variance report → investigation → corrective action → adjusted reorder quantity → reduced shrink → lower actual food cost
Risk-based inventory strategy — counting high-value, high-velocity SKUs more often while reducing cadence for low-value items — aligns your labor investment with your actual financial exposure. That's the core logic behind ABC classification.
What stocktake schedule should your venue actually use?
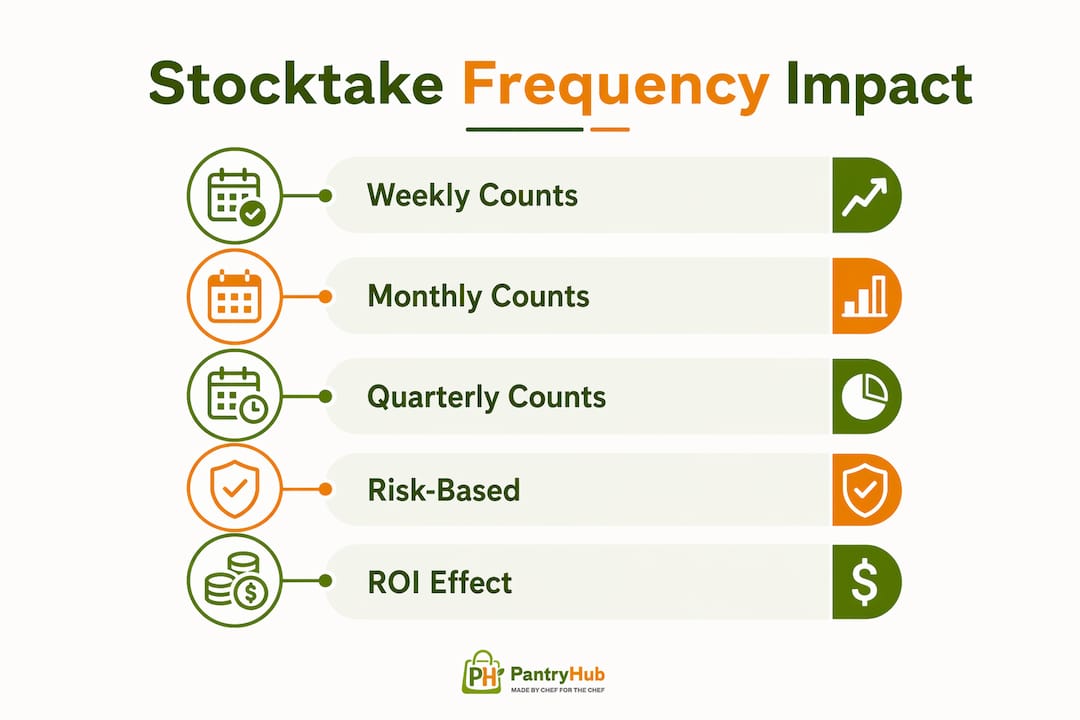
The ABC/cycle-count framework assigns every SKU to a tier based on value and velocity, then sets a counting cadence for each tier. It's the most practical way to increase frequency without burning out your team.
A items are your highest-cost, highest-risk SKUs: proteins (beef, seafood, poultry), spirits and wine, and any ingredient that represents a significant share of your weekly food spend. Count these weekly or biweekly. If a specific A item is showing repeated variance, escalate to twice weekly until the issue is resolved.
B items cover mid-value ingredients: dry goods, dairy, canned goods, and most produce. Monthly counts are the right cadence here for most venues.
C items are low-cost, low-risk: disposables, cleaning supplies, paper goods. Quarterly counts keep your records current without wasting labor on items where a discrepancy costs you $20.
| Venue Type | A Items Cadence | B Items Cadence | C Items Cadence | Approx. Count Time |
|---|---|---|---|---|
| Small café (under $30K/mo food sales) | Biweekly | Monthly | Quarterly | 30–45 min |
| Mid-size restaurant ($30K–$80K/mo) | Weekly | Monthly | Quarterly | 45–60 min |
| High-volume restaurant or bar ($80K+/mo) | Weekly | Biweekly | Monthly | 60–90 min |
| Multi-location group | Weekly per location | Monthly | Quarterly | Varies |
Four-week pilot plan for shifting A items from monthly to weekly:
- Week 1: Establish a baseline. Run a full count of all A items and record your starting variance percentage.
- Week 2: First weekly cycle count. Focus only on A items. Note count time and any discrepancies.
- Week 3: Investigate any variance flagged in week 2. Adjust count sheets based on what was hard to count. Track whether variance is moving.
- Week 4: Compare week 4 variance to baseline. Calculate the dollar value of any improvement. Decide whether to extend the pilot or formalize the schedule.
Cycle-count programs can sustain very high inventory accuracy without disruptive shutdowns — a level not achievable with annual stocktakes alone.
How to measure the impact of changing your count frequency
Before you can show ROI to your GM or owner, you need three formulas and one worked example. Here they are.
The core formulas:
- Theoretical food cost % = (Total ingredient cost per recipe × covers sold) ÷ Total food revenue × 100
- Actual food cost % = (Opening stock + Purchases − Closing stock) ÷ Total food revenue × 100
- Variance (pp) = Actual food cost % − Theoretical food cost %
- Dollar impact = Variance (pp) × Monthly food sales × (Food revenue as % of total sales)
Worked example — mid-size restaurant:
Monthly food sales: $60,000. Theoretical food cost: 28%. Actual food cost: 32%. Variance: 4 percentage points.
Dollar impact of 4 pp variance: 4% × $60,000 = $2,400/month in unexplained shrink.

After shifting A items to weekly cycle counts, variance drops to under 2 pp within 90 days, in line with the 30–40% shrink reduction benchmark observed in recent restaurant audits.
Break-even on labor: A weekly cycle count of 20–30 A items takes a manageable amount of time and labor cost, which is generally outweighed by the savings achieved. Against a median saving of $840/month, break-even is reached in the first week of the pilot.
Pilot metrics to track each week: variance percentage point, count duration, number of investigations opened, investigations closed within 7 days, and reorder adjustments made based on count data.
A variance exceeding 2 percentage points for three consecutive weeks strongly indicates an active leak and should trigger immediate investigation protocols — not just a note in the spreadsheet.
How to run an efficient stocktake without burning out your team
Efficiency is what makes higher frequency sustainable. A poorly run weekly count is worse than a well-run monthly one.
Roles for count day:
- Counter: Physically counts and records quantities. Should not be the person who ordered or received the stock.
- Verifier: Spot-checks 10–15% of counted items to confirm accuracy. Catches errors before they enter the system.
- Receiving hold: Pauses any deliveries during the count window to prevent in-transit stock from distorting figures.
- POS reconciler: Pulls sales data for the count period so theoretical usage can be calculated immediately after.
- Manager reviewer: Signs off on the variance report and assigns investigation tasks before the next shift.
Weekly cycle count checklist:
- Lock the count sheet to A items only (20–30 SKUs maximum for a targeted weekly count).
- Schedule the count just before the week's first delivery — counting before deliveries avoids miscounts from in-transit stock.
- Organize the count sheet by physical shelf order, not alphabetically. This alone cuts count time by 15–20 minutes.
- Use blind counts for your top A items: the counter records quantities without seeing the previous week's figures. This eliminates confirmation bias.
- Enter counts into your system immediately after the count, not hours later.
- Generate the variance report before end of shift.
- Assign any variance above your threshold to a named investigator with a 48-hour resolution deadline.
Pro Tip: Count your top 20–30 high-risk items to cover the majority of financial exposure. This often reduces targeted count time to 40–60 minutes and still captures 70–80% of your risk.
Escalation triggers: If any single SKU shows more than 2 pp variance for three consecutive weeks, escalate to twice-weekly counts for that item and open a formal investigation. Don't wait for month-end to act.
A worked ROI case: switching A items from monthly to weekly
Here's a realistic model you can adapt to your own numbers.
Assumptions:
- Monthly food sales: $75,000
- Recipe cost as a percentage of food sales: 30% theoretical
- Starting actual food cost: 34% (4 pp variance)
- Starting monthly shrink in dollars: $3,000
- Expected shrink reduction from weekly cycle counts: 30–40% over 90 days
- Labor cost per weekly count: $30 (1.2 hours at $25/hour)
- Additional monthly labor cost: $120
Step-through calculation:
At a 35% shrink reduction, variance drops from 4 pp to within 2 pp by day 90 and monthly shrink falls substantially. Over 12 months, this results in a significant recovery of margin, making weekly cycle counting highly cost-effective for most operations.
Break-even on the additional labor happens in month 1 under every scenario. The 30–40% shrink reduction benchmark comes from 47 restaurant audits conducted across 2025 and into 2026.
Success criteria for your 90–120 day pilot: actual food cost within 2 percentage points of theoretical, investigation backlog under 3 open items at any time, and count duration under 60 minutes per session. If you hit all three, the program is working.
Common mistakes that stop frequency from lowering food cost
More counts don't automatically mean lower variance. Frequency without discipline creates noise, not insight.
- Inconsistent scheduling: Counting on different days each week means your opening and closing stock figures don't align cleanly with your sales period. Fix: pick one day and time and protect it.
- Low-quality counts: Rushing through a count to hit a time target produces inaccurate data that's worse than no count at all. Fix: use blind counts and a verifier role.
- Counting the wrong SKUs: If your A item list hasn't been reviewed in six months, you may be counting items that no longer carry significant risk while ignoring new high-cost additions. Fix: review your ABC classification quarterly.
- Ignoring investigations: A variance report that no one acts on is just paperwork. Fix: assign every flagged item to a named person with a deadline before the count sheet is filed.
- Full-house weekly counts: Counting every SKU every week is unsustainable and unnecessary. Fix: cycle counting for A items only, with B and C on their own cadence.
Red flags that your program is failing: variance is rising despite more frequent counts (suggests counting errors, not real improvement), your investigation backlog is growing week over week, or staff are visibly resistant and cutting corners on count accuracy. When you see these signs, pause and fix the process before adding more frequency. Common inventory mistakes often compound when frequency increases without the right structure behind it.
Stocktakes carry hidden costs — labor, potential disruption, and the risk of accidental damage during counts — that must be weighed against the cost of inaction. Digital tools minimize those hidden costs and make frequent counts viable.
Key Takeaways
More frequent, risk-based stocktakes reduce food-cost variance faster than any other single operational change — weekly cycle counts for A items typically close a significant variance gap within a few months.
| Point | Details |
|---|---|
| Weekly counts for A items | Proteins, alcohol, and high-cost produce should be counted weekly to detect shrink within 7 days, not 30. |
| 2 pp threshold rule | Variance above 2 pp for three consecutive weeks signals an active leak requiring immediate investigation. |
| Break-even is fast | Additional weekly labor costs are typically recovered quickly from reduced shrink. |
| Consistency beats brute frequency | A fixed day and time before deliveries produces faster, more accurate counts than random scheduling. |
| Pantryhub cuts count time | Digital stocktakes with Pantryhub reduce targeted count sessions to 45–60 minutes and automate variance reporting. |
The case for weekly counts is stronger than most managers realize
The conventional wisdom in restaurant operations is that monthly stocktakes are "good enough" — that the labor cost of counting more often outweighs the benefit. That view is wrong, and the math makes it obvious.
Monthly counts are post-mortems. By the time you see a 4 pp variance on your month-end report, you've already absorbed the full loss. You can investigate the cause, but you can't recover the margin. Weekly cycle counts function as prevention — they surface a problem when it's a $500 issue, not a $5,000 one.
What most managers underestimate is the behavioral effect. When your team knows that A items are counted every week, the culture around product handling shifts. Unrecorded waste drops. Portioning tightens. That cultural change is worth as much as the data itself, and it doesn't show up in any formula.
The other thing that gets missed: frequency changes your relationship with your suppliers. When you have accurate on-hand figures every week, your orders get tighter. You stop over-ordering to cover uncertainty. Carrying costs drop. Emergency purchases become rare. The ROI of weekly cycle counting isn't just the shrink reduction — it's the compounding effect across waste, ordering, and team behavior.
Start with your top 20 A items. Run four weeks. Measure the variance. Most operators see actual food cost stabilize within 2 percentage points of theoretical by day 120.
Pantryhub makes weekly cycle counts practical, not painful
Running weekly counts manually — paper sheets, spreadsheet entry, manual variance calculations — is exactly what makes managers reluctant to increase frequency. Pantryhub removes that friction.


With Pantryhub's digital stocktake tools, your team counts using a mobile device or barcode scanner, and the variance report generates automatically. No transcription. No formula errors. No waiting until the next morning to see where the numbers landed. Operators using digital counting tools report cutting count time from multi-hour sessions to 45–60 minutes for targeted A-item lists — which means the labor cost argument against weekly counts largely disappears.
Pantryhub also connects your count data directly to supplier ordering, so when a count shows you're running low on a high-cost protein, a reorder can go out the same day. Low-stock alerts mean you're never caught short between counts. And with multi-location reporting, a group manager can see variance across every site in one view.
A practical starting point: run a 30–60 day Pantryhub-assisted weekly cycle pilot for your A items. Set your 2 pp investigation threshold inside the platform, track variance week by week, and measure count time against your current manual process. Book a demo or start a free trial at pantryhub.com.au to see how the numbers change.
Useful sources and further reading
- Restaurant Inventory Control 2026: Myth vs Reality — audit data on shrink reduction from weekly cycle counting and time-to-stabilization benchmarks
- How Often Should We Stocktake? Frequency Models Based on Risk & Stock Movement — ABC classification framework and risk-based cadence guidance
- Cycle Counting vs Annual Stocktake: Complete Guide — accuracy benchmarks and the case for cycle counting over annual-only programs
- Food Inventory Management: Cut Waste & Grow Profits — why inaccurate inventory distorts food-cost percentages
- Prepare for Stocktake | business.gov.au — practical guidance on stocktake costs, benefits, and frequency decisions
- Kitchen Stocktake Process: A Manager's Practical Guide — Pantryhub's step-by-step checklist for running efficient kitchen counts
- How to Handle Stock Discrepancies in Your Restaurant — investigation workflows for closing variance items after a count