
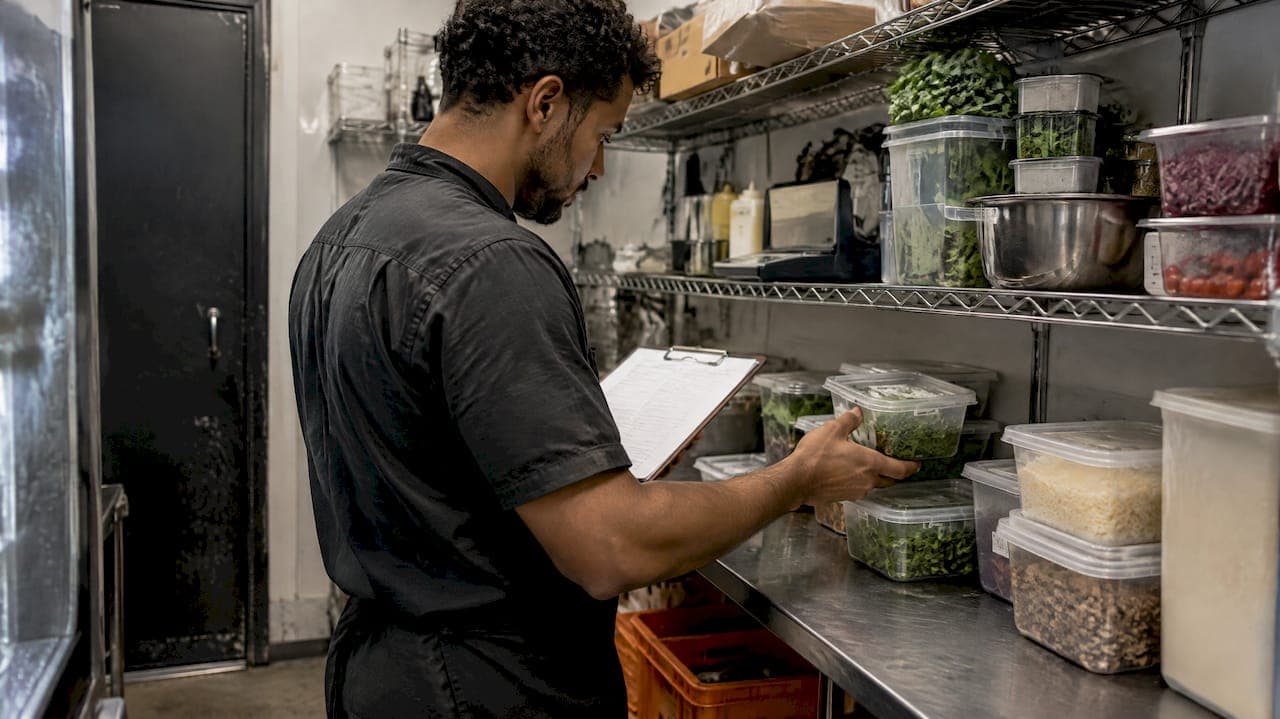
An inventory aging report shows how long each item has been sitting on your shelves, in your coolroom or in the freezer, grouped into age bands. For a restaurant, café, pub or club, it is the quickest way to spot stock that is quietly eating into margins: the case of sauce nobody orders, the premium spirit that sold twice last quarter, the protein that is one busy weekend from the bin. This guide covers how to read one, how to build one, and which age bands suit hospitality.
TL;DR
- An inventory aging report (also called a stock aging report or inventory age analysis) groups stock by how long it has been held, so slow movers stand out.
- Generic bands such as 0 to 30 and 31 to 60 days suit dry goods, bar stock and packaging. Fresh food needs day-level tracking against use-by dates.
- Average inventory age is (average inventory cost ÷ cost of goods sold) × 365. Track it monthly, per category.
- Rotating stock first in, first out, and checking use-by dates, are food safety basics in Australia. An aging report shows where those habits are slipping.
- You can build one in a spreadsheet, but a platform that records receiving dates and expiry dates builds it for you. Start your free trial.
Table of Contents
- What an inventory aging report actually is
- Why aging stock matters in a hospitality venue
- How to calculate inventory age
- Choosing age bands that suit food and drink
- What a useful hospitality aging report should include
- How the report gets built: the FIFO logic
- Build one in a spreadsheet: a basic method
- Reading the report: what the numbers are telling you
- Age is not the same as safety
- Ways to bring aging stock down
- Our perspective: age data only works if it is easy to capture
- How PantryHub helps you see aging stock
- FAQ
- Sources
What an inventory aging report actually is
An inventory aging report is a snapshot of the age distribution of your stock, grouped into time brackets. Shopify's guide describes it as listing SKUs or product types, units available and average inventory age. Microsoft's supply chain documentation describes the same idea in accounting terms: on-hand quantity and inventory value for an item or item group, split into period buckets.
You will see the same report under several names. Stock aging report, aging stock report, inventory age analysis and stock age analysis all point to the same thing. A slow moving stock report is a close cousin. It usually lists only the items that fall into the older bands, which is the part you act on.
In a warehouse, the report is mostly about tied-up cash and storage space. In a kitchen or bar it does more work. Age also affects quality, safety and what you can legally serve.
Why aging stock matters in a hospitality venue
Aging inventory is, in general, low-demand stock that sells slowly or not at all. It ties up cash and adds storage costs. In hospitality, three extra problems sit on top:
- Waste. Fresh produce, dairy and proteins have short lives. Overordering turns directly into a bin line on your P&L.
- Menu drag. Items that barely sell can be a sign a dish is not working, or that a par level is set too high.
- Food safety exposure. Stock that has been forgotten at the back is stock that may pass its use-by date.
On that last point, the NSW Food Authority guidance says all stock should be rotated first in, first out (FIFO), use-by dates checked before use, and food past its use-by date discarded. Food past its best-before date may still be used if the quality is satisfactory. The guidance is written for food service to vulnerable persons, but the rotation habits apply to any kitchen.
Traceability is part of the picture too. GS1 Australia notes that foodservice traceability depends on accurately identifying products and where they are, supporting food safety, faster recalls and less waste. If your records show when each delivery arrived, a recall or a supplier query takes minutes instead of a morning of shelf-checking.
How to calculate inventory age
There are two calculations worth knowing. The formulas below follow the standard approach set out in Shopify's inventory aging guide.
Average inventory age = (average inventory cost ÷ cost of goods sold) × 365 days
Inventory turnover = cost of goods sold ÷ average inventory value
Here is a worked example for a café, using round numbers for illustration only:
- Average stock on hand (dry goods and packaging, at cost): $6,000
- Cost of goods sold over the year for that category: $72,000
- Average inventory age: ($6,000 ÷ $72,000) × 365 = about 30 days
- Turnover: $72,000 ÷ $6,000 = 12 times a year
A 30-day average sounds fine for dry goods. But averages hide problems. If $1,000 of that stock is a single bulk buy of specialty flour that has sat for six months, the average barely moves. That is why the age-band view matters more than one headline number.
Days of cover: the number kitchens actually feel
Another useful measure is days of cover: current quantity divided by average daily usage. As Hopstack's knowledge base explains, 200 units with average outbound demand of 20 a day gives 10 days of cover. In a kitchen, translate that straight into ordering. If you hold 14 days of cover on a product with a 7-day shelf life, you already know the answer.
Choosing age bands that suit food and drink
Bands must match the product. Shopify's guidance makes the point that fashion may need weekly analysis, while refrigerated perishables may need day-level monitoring. Hospitality is the same: one set of bands will not fit the whole venue.
Bands should not overlap, and the last band should be open-ended so nothing falls off the report. Hopstack recommends this setup. For longer-lived stock, Inventory Planner lists practical bands of 0 to 30, 31 to 60, 61 to 90, 91 to 180, 181 to 365 and over 365 days.
Here is how that translates into a venue:
| Stock type | Suggested bands | What to look for |
|---|---|---|
| Fresh produce, dairy, fresh proteins | 0 to 1, 2 to 3, 4 to 5, 6+ days | Anything near its use-by; deliveries that outpace usage |
| Frozen proteins and prepared items | 0 to 14, 15 to 30, 31 to 60, 61+ days | Freezer stock that never gets rotated forward |
| Dry goods and pantry items | 0 to 30, 31 to 60, 61 to 90, 91+ days | Bulk buys and one-off specialty ingredients |
| Bar: spirits, wine, packaged drinks | 0 to 30, 31 to 90, 91 to 180, 181+ days | Ranges added for a promotion that never took off |
| Beer kegs and kegged products | 0 to 14, 15 to 30, 31+ days | Slow lines tying up cold room space |
| Packaging and consumables | 0 to 60, 61 to 180, 181+ days | Over-stocked takeaway containers and custom-printed items |
These bands are our suggested starting points for hospitality, not a standard. Adjust them to your own turnover and to the shelf life printed on your suppliers' labels.
What a useful hospitality aging report should include
A report that only lists item names and ages is thin. These fields make it usable on a Monday morning:
- Item and category, so you can filter by food, bar, packaging and so on.
- Received date of the oldest batch on hand.
- Nearest expiry or use-by date, and quantity expiring within a set window such as 3 or 7 days.
- Quantity and cost value in each band, so you see dollars at risk and not just units. Inventory Planner notes that units, cost and retail value are all useful, with filters by category, vendor or product.
- Supplier, so repeat offenders show up in the supplier conversation.
- Location, which matters if you run more than one venue or have separate cool rooms, bars and storerooms.
- Days of cover, so ordering decisions come straight off the report.
Hopstack's list also includes oldest received date, nearest expiry date, quantity expiring within 30 days and expired quantity. For a kitchen, shorten that 30-day window to match your shelf lives.
How the report gets built: the FIFO logic
Behind most aging reports is a simple rule. Microsoft's documentation explains that bucket quantities come from summarizing received quantities by period and applying FIFO to deduct issued quantities. In plain terms: the system assumes the oldest stock gets used first, so what remains on hand must be the newest.

That assumption only holds if your team actually rotates stock. If the newest delivery gets used first because it is nearest the door, the report will understate how old your oldest stock is. So the report is only as honest as your receiving and rotation habits. Our guide on six-step FEFO expiry date tracking covers the first-expired, first-out version of this, which is usually the better rule for perishables.
Build one in a spreadsheet: a basic method
If you are not ready for software, you can still get value. Here is a simple process:
- Record every delivery. Log item, supplier, quantity, cost and delivery date. Add the use-by or best-before date from the label.
- Do a regular count. ChefCollective suggests counting at least monthly, with more frequent counts for high-volume or fast-turnover operations. Weekly counts for fresh categories are a sensible target.
- Work out age. Subtract the received date from today's date for each batch still on hand.
- Assign bands. Use a lookup or nested IF formula to place each batch in a band.
- Summarize. Use a pivot table to total quantity and cost by band and by category.
- Review and act. Sort by the oldest band and by value at risk.
The weak points are obvious. It relies on someone entering every delivery, batches blur together, and the sheet is out of date within days. That is where most venues give up, and why many move to a platform that captures dates at receiving.
Reading the report: what the numbers are telling you
A band with a lot of cost in it is a prompt for a question, not a conclusion. Work through these in order:
- Is it a par level problem? If you hold three weeks of an item you use in one, lower the par and the reorder point.
- Is it a menu problem? An ingredient used by one dish that rarely sells points to a dish worth reworking, repricing or dropping.
- Is it a supplier problem? Minimum order sizes can force you to buy more than you use. Ask for smaller pack sizes or split deliveries.
- Is it a rotation problem? If the same item is old in several venues, the cause is process, not demand.
- Is it a counting problem? Stock that appears old but is not physically there is a record error. ChefCollective says comparing actual usage with expected usage from recipes and sales can reveal inaccurate portions, recipe errors, waste, theft or shrinkage.
For a deeper look at the last point, see our guides to inventory accuracy and restaurant profitability and ingredient-level stock tracking.
Age is not the same as safety
An aging report tells you how long something has been held. It does not tell you whether it is safe. The FSANZ food safety standard says the safe storage time for potentially hazardous food depends on the food's characteristics, the microorganisms that may be present and the conditions under which it is kept. Two identical batches can have very different safe lives if one sat in a cold room that drifted warm.
The practical rules are specific. The NSW Food Authority guidance says potentially hazardous cold food should be held at 5°C or below, hot food at 60°C or above, and frozen food kept hard frozen. If you hold cooked food hot between services, this overview of hot holding temperatures for foodservice explains the equipment side. Rules differ slightly by state and territory, so confirm what applies to you with your local council environmental health officer or your state food authority.

Treat use-by dates as hard stops. If an item is past its use-by date, it comes off the shelf, whatever your report says about value at risk. Best-before is about quality, and your chef's judgment applies.
Ways to bring aging stock down
Once you can see the problem, the fixes are usually simple:
- Run it as a special. Build a daily special around items in the oldest fresh band, within their use-by dates.
- Cross-utilize. Add a second use for slow ingredients, such as a sauce or garnish across several dishes.
- Cut par levels and order more often. Smaller, more frequent orders usually beat large, infrequent ones for fresh lines.
- Rotate on receiving. Label every delivery with the received date and put new stock behind old.
- Promote slow bar lines. Feature a slow spirit in a cocktail special or bring a slow wine on by the glass.
- Transfer between venues. If one site holds surplus and another is running low, move it before it ages.
- Retire what does not sell. Take dead lines off the menu and stop reordering them.
If you also adjust prices after reading the report, remember that ingredient cost changes flow through to your menu. Re-cost the dish before you update menu prices, so a discount on aging stock never becomes a permanent margin hit.
For bar-specific tactics, our guide to managing bar inventory efficiently goes further. If you are still weighing up whether you need software at all, read 7 signs your kitchen needs inventory software.
Our perspective: age data only works if it is easy to capture
PantryHub was built by a chef, for chefs, and we have seen the same pattern in kitchens of every size. Owners know in their gut that something at the back is going off. What they lack is a number they can act on without losing an hour at the pass.
We think an aging report for hospitality should do three things. It should capture dates at the moment stock arrives, on a phone, while the delivery is still on the bench. It should flag what is close to expiry before it becomes waste. And it should sit next to ordering, so the same screen that shows an over-stocked item also stops you reordering it.
That is why we focus on real-time stock tracking, low-stock alerts, supplier ordering and waste and cost reporting in one place, with Australian suppliers, AUD pricing and GST-ready reporting. A report you have to build by hand once a quarter is a report that gets skipped. A report that updates as your team works gets used.
— Admin
How PantryHub helps you see aging stock
PantryHub gives single venues and multi-site groups real-time visibility of what is on hand, what is running low and what you are spending.
- 📦 Real-time stock tracking across one or many locations
- 🔔 Low-stock alerts so you reorder on time, not in a panic
- 🛒 Supplier ordering built around Australian suppliers
- 👥 Team access controls so the right people count and order
- 📊 Waste and cost reporting to show where margin is leaking
Plans are published on our pricing page: Starter is $39 per month, Regular is $69 per month and Pro is $99 per month, all in AUD. Every plan starts with a free trial. Start your free trial and see your own stock in one place. If you are in Western Australia, see our page on restaurant inventory software in Perth. Comparing options first? Our Australian food inventory software guide sets out what to look for.
FAQ
What is the difference between an inventory aging report and a slow moving stock report?
An inventory aging report lists all stock grouped by how long it has been held. A slow moving stock report is usually a filtered view of the same data, showing only items that sell slowly or not at all. Most venues use the aging view to find the problem and the slow-moving view to decide what to do about it.
How often should I run a stock aging report?
For fresh food, check weekly or even daily against use-by dates. For dry goods, bar stock and packaging, monthly is usually enough, in line with at least monthly counts. Venues with high volume or fast turnover should count more often.
What age bands should a café or pub use?
There is no single standard. Fresh items need day-level bands, frozen stock suits two-week and monthly bands, and dry and bar stock suit 30-day steps with an open-ended last band. Match the bands to the shelf life of what you hold, and keep them from overlapping.
Can I use a debtors ageing report for stock?
The layout is similar, because both group amounts by age, but the purpose differs. A debtors report ages unpaid invoices, while an inventory aging report ages physical stock by receiving date. Do not mix the two: stock age needs batch and expiry data, not invoice dates.
Sources
- Inventory Aging Report: What It Is & How to Use It, Shopify Australia
- Inventory Aging Report: What It Is & How to Use It, Shopify
- Inventory aging report examples and logic, Microsoft Learn
- Inventory Aging Report, Hopstack Knowledge Base
- Aging analysis report, Inventory Planner Help Center
- Foodservice, GS1 Australia
- Guidelines for food service to vulnerable persons, NSW Food Authority
- Standard 3.2.2 Food Safety Practices and General Requirements, FSANZ
- How to Master Your Restaurant Inventory Management in 5 Easy Steps, ChefCollective
- Hot Holding Temperatures for Foodservice, Superior Kitchen Equipment