
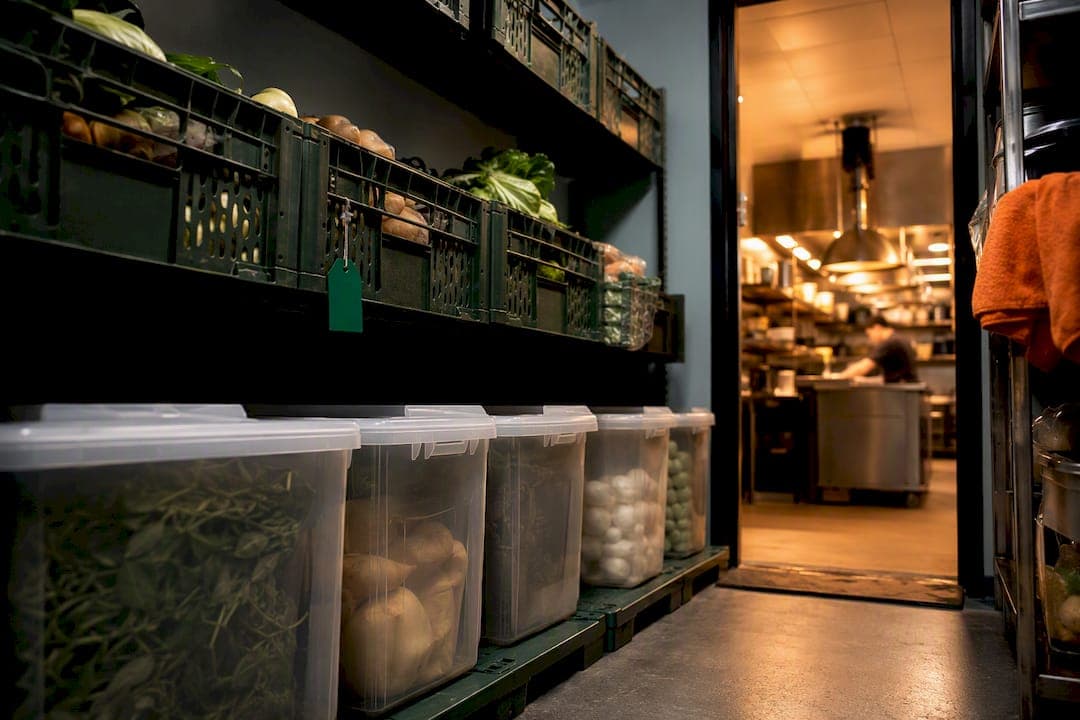
Safety stock equals average daily usage times supplier lead time, plus a buffer for demand swings and delivery delays. Review high-risk items daily, run full counts weekly, and check trends monthly. That rhythm, backed by real-time tracking through a platform like PantryHub, keeps you from running out of the ingredients your menu depends on.
TL;DR:
- Safety stock should be tailored to product type, with one day's extra usage for perishables and 15% to 20% buffers for dry goods, adjusted through ABC prioritization.
- Real-time data from platforms like PantryHub improves safety stock accuracy by providing current usage figures and automatic low-stock alerts.
- Variability in supplier lead time, especially when range widens, significantly increases safety stock requirements beyond the average lead time.
- Counting accuracy, unit consistency, and supplier performance monitoring are critical operational factors that prevent safety stock miscalculations.
- Safety stock should be a dynamic figure, updated regularly based on changes in demand, supplier reliability, and seasonal demand shifts.
Table of Contents
- What Safety Stock Actually Means in a Restaurant
- Why Getting This Wrong Costs You Twice
- The Basic Safety Stock Formula, With Two Worked Examples
- When to Use the Statistical Safety Stock Formula
- Turning Safety Stock Into a Reorder Trigger
- Setting Safety Stock by Product Type
- Mistakes That Quietly Break Your Safety Stock Numbers
- How Real-Time Tracking Makes Safety Stock Practical
- Why Supplier Lead Time Swings Change Everything
- Fitting Safety Stock Into Your Broader Inventory Strategy
- Real Adjustments: Three Scenarios Worth Learning From
- A Practical Weekly Cadence for Managing Safety Stock
- PantryHub: Putting Safety Stock on Autopilot
- What Managers Get Wrong About Safety Stock Discipline
- Sources
- FAQ
What Safety Stock Actually Means in a Restaurant
Safety stock is the extra inventory you hold beyond expected usage to cover the unpredictable stuff: a supplier truck stuck in traffic, a Saturday night that runs 30% busier than forecast, a case of chicken thighs that turns out short two pounds. It's not the same as par level, and it's not the same as buffer stock either, even though managers use all three terms interchangeably at their own peril.
Par level is your target total on-hand quantity, calculated as average daily usage multiplied by lead time, plus safety stock, per restaurant inventory guidance from FORCS. Safety stock is the buffer piece inside that number, not the whole thing.
Buffer stock is often used as a casual synonym for safety stock, but some operators use it specifically for seasonal or promotional cushions rather than everyday variability.
Safety stock earns its keep on:
- Perishable proteins with tight prep windows and no backup supplier
- Well liquor and house-pour spirits that anchor your cocktail menu
- Any SKU tied to a current promotion, catering contract, or menu feature
Why Getting This Wrong Costs You Twice
Run out of a key ingredient on a Friday night and you don't just lose that sale. You lose the table's trust, the server's tip, and possibly the review. Stockouts on menu-anchor items are one of the fastest ways to tank a night's covers, and the damage compounds when it happens during your highest-traffic hours.
Overcorrect, though, and you bleed money a different way. Excess safety stock ties up cash in the walk-in, raises spoilage risk on anything perishable, and inflates your holding costs on dry goods that just sit there depreciating in value if not in weight.
The math gets murkier when your counts are wrong. A kitchen that measures in "cases" one week and "each" the next is building phantom variability into its own numbers. According to NetSuite's restaurant inventory research, combining perpetual tracking with regular physical counts is what actually keeps demand and spoilage in balance. Unit inconsistency alone can force you into carrying more safety stock than the real variability in your kitchen requires.
The Basic Safety Stock Formula, With Two Worked Examples
The core formula is short enough to write on a napkin:
Safety Stock = (Average Daily Usage × Lead Time) − (Average Daily Usage × Average Lead Time), or more simply for most kitchens: build in a buffer of extra days' usage on top of what you'd need if everything arrived exactly on schedule. Combined with lead time, this feeds directly into your par level, calculated as average daily usage times lead time plus safety stock, according to FORCS's par-setting model.
Example A: Fresh Salmon Fillets (Perishable, Short Lead Time)
- Average daily usage: 18 fillets
- Supplier lead time: 1 day
- Base need: 18 × 1 = 18 fillets
- Add a 1-day safety buffer for delivery delays: 18 fillets
- Total par: 36 fillets, with safety stock representing half that number
Example B: Canned Tomatoes (Dry Good, Longer Lead Time)
- Average daily usage: 4 cases
- Supplier lead time: 5 days
- Base need: 4 × 5 = 20 cases
- Add a 20% buffer for demand swings and delivery variance: 4 cases
- Total par: 24 cases
Notice the buffer shrinks proportionally as shelf-stable goods carry lower spoilage risk, while perishables need a higher percentage cushion relative to their short cycle.
Pro Tip: Standardize every count sheet to a single unit per item before you calculate anything. A "case of tomatoes" that's sometimes 6 cans and sometimes 12 will wreck your safety stock math faster than any supplier delay.
When to Use the Statistical Safety Stock Formula
The basic formula works fine for most kitchens. Multi-location groups, high-value SKUs, or anything with genuinely volatile demand deserve a sharper tool: the statistical safety stock method built around service level and z-score.
This approach needs three inputs:
- Standard deviation of daily demand for the item
- Variability in supplier lead time, not just the average
- Your target service level, converted into a z-score, the statistical multiplier that translates "how often can I afford to stock out" into a number you can plug into a formula, as explained in MIT's overview of standard deviation and sigma
A 95% service level corresponds to a z-score of roughly 1.65. Multiply that by the standard deviation of demand during lead time, and you get a statistically grounded safety stock figure instead of a gut-feel percentage.
This is overkill for a single café ordering basil twice a week. It earns its place when you're running six locations with shared central purchasing, or when a single premium spirit SKU represents thousands of dollars in tied-up capital. Getting the inputs right requires clean historical usage data, which is exactly what perpetual tracking systems are built to capture.
Turning Safety Stock Into a Reorder Trigger
Safety stock only works if it's connected to an actual ordering rule. That's what the reorder point (ROP) does: it tells you the exact inventory level that should trigger a new order, before you dip below your safety cushion.
- Calculate ROP as (Average Daily Usage × Lead Time) + Safety Stock, the standard formula outlined by AccountingTools
- Set your ordering system, whether that's a clipboard or software, to flag items the moment on-hand quantity crosses that ROP line
- Build an emergency-order protocol for anything that slips below ROP unexpectedly, with clear approval authority so nobody's guessing who can call the supplier
- Recalculate ROP immediately whenever a supplier's typical lead time changes, rather than waiting for the next scheduled review
A supplier who used to deliver in 2 days but now runs 4 days needs their ROP recalculated that week, not at your next quarterly review. Lag on this one adjustment is how kitchens end up improvising with substitutions on a busy Saturday.
Setting Safety Stock by Product Type
Different categories carry fundamentally different risk profiles, so a single blanket safety stock percentage across your whole inventory wastes effort in some places and leaves gaps in others.
- Fresh proteins and produce: Keep safety stock lean, roughly 1 day's extra usage, since spoilage risk outweighs stockout risk for most items
- Frozen goods: A 2 to 3 day buffer is usually safe given the longer shelf window
- Dry goods: 15% to 20% buffer above base need works well, since shelf life gives you room to run higher stock
- Alcohol and spirits: Set buffers around your top sellers specifically; slow movers need almost none
Layer ABC prioritization on top of this. About 20% of your items typically drive 70% to 80% of revenue, according to GEP's analysis of ABC inventory methodology, so those A-items get daily counts, B-items get weekly attention, and C-items only need a monthly glance.
Pro Tip: Your top-selling spirit and your slowest-moving garnish do not deserve the same counting frequency. Spend your labor minutes where the revenue actually is.
Mistakes That Quietly Break Your Safety Stock Numbers
Most safety stock failures aren't formula errors. They're operational leaks that make good math produce bad results.
- Unit mismatch: Ordering in cases but counting in reaches (or vice versa) corrupts every calculation downstream
- Inconsistent count timing: Counting Tuesday morning one week and Thursday night the next makes usage data meaningless
- Ignoring supplier performance: Treating every delivery as on-time when your actual fill rate is slipping
- No rotation discipline: Skipping FIFO or FEFO rotation lets older stock hide behind newer stock, masking real usage
Fixes you can implement this shift: standardize your unit of count across every sheet, organize counts by storage location so the process follows a logical walk-through, and add a simple date-label rule at receiving so FIFO rotation happens automatically. Pair that with the common inventory mistakes restaurants make and a clear stock rotation routine, and most of these leaks close within a week.
How Real-Time Tracking Makes Safety Stock Practical
Formulas are only as good as the usage data feeding them. That's the gap most kitchens hit: the math is straightforward, but pulling accurate average daily usage out of a spreadsheet updated twice a week is nearly impossible.
Connecting point-of-sale data directly to inventory turns theoretical usage into measured usage, so weekly counts become a verification step instead of a data-entry chore. PantryHub was built around that exact problem, giving operators:
- Real-time stock visibility that updates as items are sold or received
- Low-stock alerts that trigger before you hit your safety stock floor, not after
- Supplier ordering built into the same platform where your counts live
- Multi-location reporting for groups running the statistical safety stock method across sites
For a deeper look at capturing usage at the ingredient level, the ingredient-level stock tracking guide walks through how recipe-level data feeds directly into these calculations, and the ABC inventory analysis breakdown shows how to apply that prioritization inside your own counting routine.
Why Supplier Lead Time Swings Change Everything
Every safety stock formula treats lead time as an input, but lead time is rarely a fixed number. It's a range, and the width of that range matters more than the average.
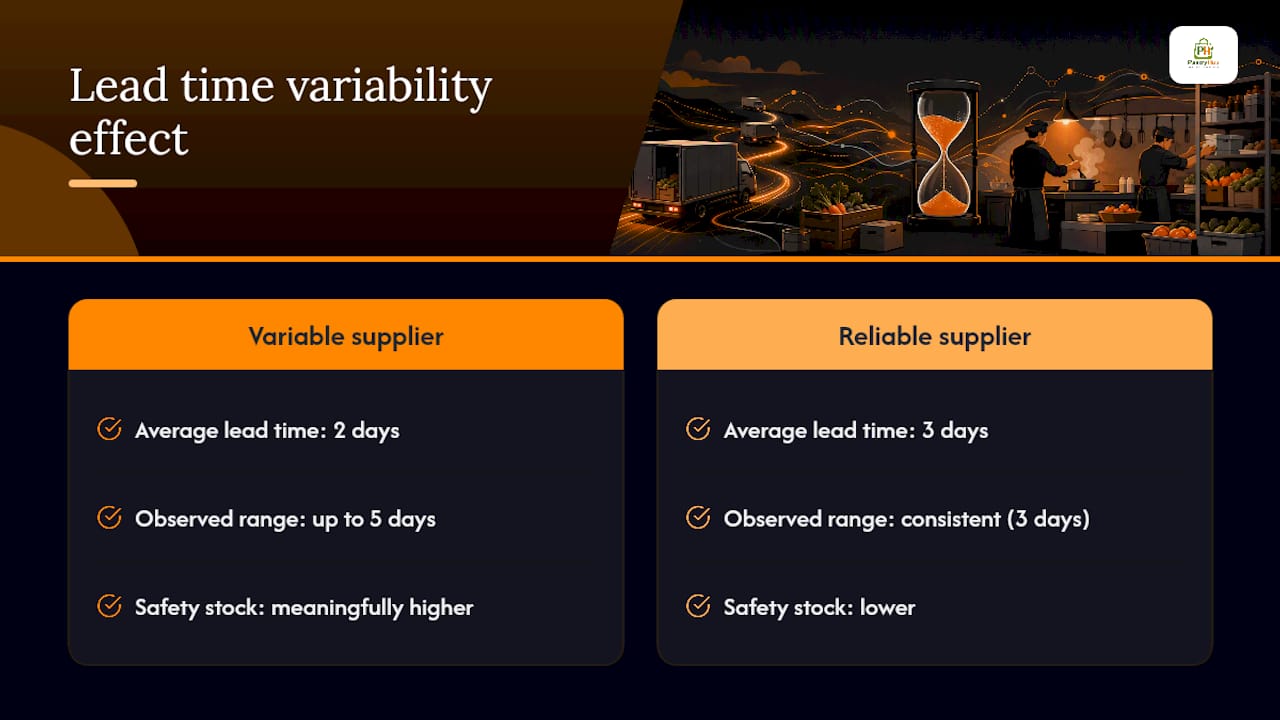
A supplier who delivers in 2 days on average but sometimes takes 5 forces you to carry meaningfully more safety stock than a supplier who reliably delivers in 3 days every single time, even though the averages look similar on paper. Variability, not the mean, is what drives risk.
This is where the connection to online ordering and demand forecasting gets interesting. Platforms that manage the role of online food ordering in shaping restaurant demand patterns are also changing how predictable your outbound orders need to be, since third-party delivery spikes can hit with little warning and put pressure on the same suppliers everyone else is calling.
When a supplier's fill rate starts slipping, the correct move is to raise safety stock for the affected SKUs immediately, not to wait for your next scheduled review, based on findings on inventory software adoption. Treat a missed delivery, a partial shipment, or a substituted item as a signal, not a one-off inconvenience.
Seasonality compounds this further. A supplier who handles your regular volume fine in February may struggle in December when every restaurant in the region is ordering the same holiday proteins. Build seasonal lead-time assumptions into your ROP recalculations ahead of known high-demand periods, and check the seasonal menu stock management guide before your next predictable seasonal shift.
Fitting Safety Stock Into Your Broader Inventory Strategy
Safety stock isn't a standalone tactic. It's one input inside a larger system that includes menu engineering, purchasing cycles, waste tracking, and cash flow planning.
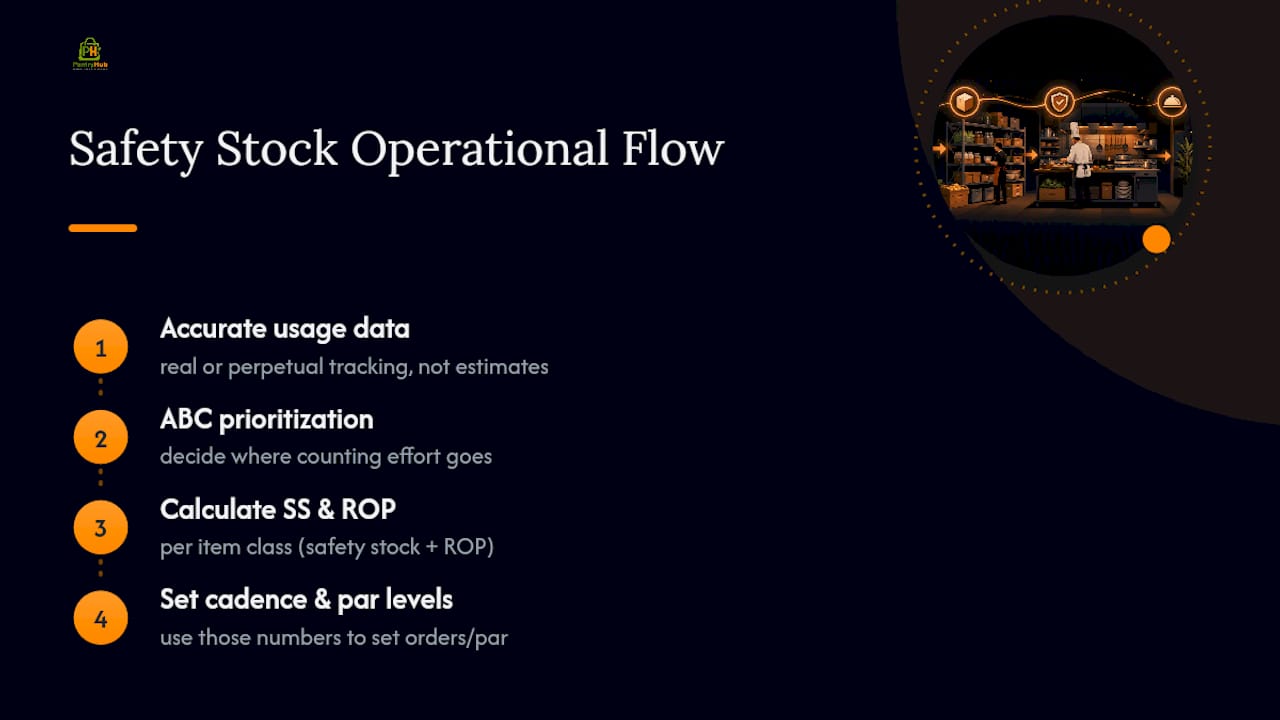
The order of operations matters. Start with accurate usage data (real or perpetual tracking, not estimates), layer in ABC prioritization to decide where counting effort goes, calculate safety stock and ROP per item class, then let those numbers set your ordering cadence and par levels. Skip a step, and everything downstream inherits the error.
This is also where integrations between your booking and ordering channels earn their place. Systems that sync reservation data, like OpenTable integration with POS platforms, give you an early signal on a busy weekend before it hits your walk-in, letting you nudge safety stock up on key items a day or two ahead rather than reacting after the fact.
Waste logging closes the loop. If an item's actual spoilage consistently outpaces its projected shelf life, that's a signal your safety stock is set too high for that SKU, not too low. Cost reporting and safety stock calculations should feed each other constantly, not sit in separate spreadsheets that nobody cross-checks.
Real Adjustments: Three Scenarios Worth Learning From
Scenario one: the promo that outran its pars. A gastropub running a weekend wing special saw the item sell out by 8 PM three weeks running. The fix wasn't more safety stock everywhere, it was raising the par specifically for wing portions ahead of the promo window, following the same logic FORCS recommends for pars ahead of promotions.
Scenario two: the supplier that slipped quietly. A multi-location group noticed their produce supplier's on-time rate had dropped without anyone flagging it. Once the lead-time variability showed up in their counts, they raised safety stock on lettuce and herbs by roughly a day's usage, and stockouts on salad-heavy menu items stopped within two weeks.
Scenario three: the case of miscounted cases. A bar operator discovered their "case" of vodka in the ordering system meant 12 bottles to the supplier but staff had been counting it as 6. The resulting phantom shortage triggered unnecessary emergency orders for months until the unit mismatch was caught and standardized across every count sheet.
A Practical Weekly Cadence for Managing Safety Stock
Keep it simple enough that your team actually follows it. Check your A-items daily and reconcile every delivery against the invoice the moment it arrives. Run a full count weekly, timed to your ordering window, and adjust reorder points wherever lead time or usage has shifted. Once a month, review usage trends and supplier fill rates; once a quarter, reassess your ABC classifications and buffer percentages entirely, since menu changes and seasonal shifts can quietly move an item from B to A.
PantryHub: Putting Safety Stock on Autopilot
Running these formulas by hand works until service gets busy and the spreadsheet falls a week behind. This platform offers an alternative to juggling disconnected spreadsheets and supplier emails, designed with local pricing and support tailored for hospitality businesses.

Real-time stock tracking means your average daily usage numbers are always current, not estimated from last month's count. Low-stock alerts flag items approaching their safety stock floor before they hit zero, and supplier ordering lives inside the same platform, so raising a par ahead of a promo takes minutes, not a round of phone calls. Recipe-level usage tracking connects your POS sales straight to ingredient depletion, giving you the clean data the statistical safety stock method actually needs.
Plans start with the Starter tier at $39 AUD per month, with Regular and Pro tiers scaling up as your locations and reporting needs grow. If you'd rather see it running in your own kitchen first, start a free trial and connect it to this week's counts.
What Managers Get Wrong About Safety Stock Discipline
The conventional advice treats safety stock like a one-time setup task: calculate it once, plug it into your par sheet, move on. That's backward. Safety stock is a living number that should shift every time a supplier's reliability changes, every time a menu item gets promoted, and every time a season turns.
What gets underestimated is how much of the "safety stock problem" is actually a counting problem wearing a disguise. A kitchen with sloppy unit conversions and inconsistent count timing will always look like it needs more buffer than it actually does, because half its apparent demand variability is measurement error, not real fluctuation. Fix the counting discipline first, and often the safety stock number you actually need turns out smaller than the one you've been carrying out of habit.
The other blind spot is treating every SKU as equally worthy of the statistical rigor. Most restaurants don't need z-scores and standard deviations for their napkin order. They need clean data on the dozen items that actually drive their food cost, and a fast, reliable way to spot when a supplier's performance has quietly slipped. Get the fundamentals right on those items, and the fancier math becomes a refinement, not a rescue.
— Admin
Sources
- What is the EOQ & Reorder Point? — AccountingTools
- Restaurant inventory management — NetSuite
- Restaurant inventory management — FORCS / USEFORCS
FAQ
What is EOQ and how does it relate to ROP?
EOQ, or economic order quantity, is the order size that minimizes total ordering and holding costs, while ROP is the inventory level that triggers placing that order, calculated as average daily usage times lead time plus safety stock, per AccountingTools.
What's the difference between buffer stock and safety stock?
The two terms overlap heavily, but many operators use "buffer stock" specifically for seasonal or promotional cushions and reserve "safety stock" for everyday demand and lead-time variability.
How do I calculate safety stock for my restaurant?
Start with the basic formula: average daily usage multiplied by lead time, plus an added buffer for delivery delays or demand swings, then move to the statistical z-score method once you have reliable historical usage data, ideally captured through a real-time platform like PantryHub.
Does PantryHub help set safety stock levels automatically?
PantryHub tracks real-time usage and flags items approaching their safety stock floor through low-stock alerts, giving you the accurate data needed to calculate and adjust safety stock without manual spreadsheet work.