
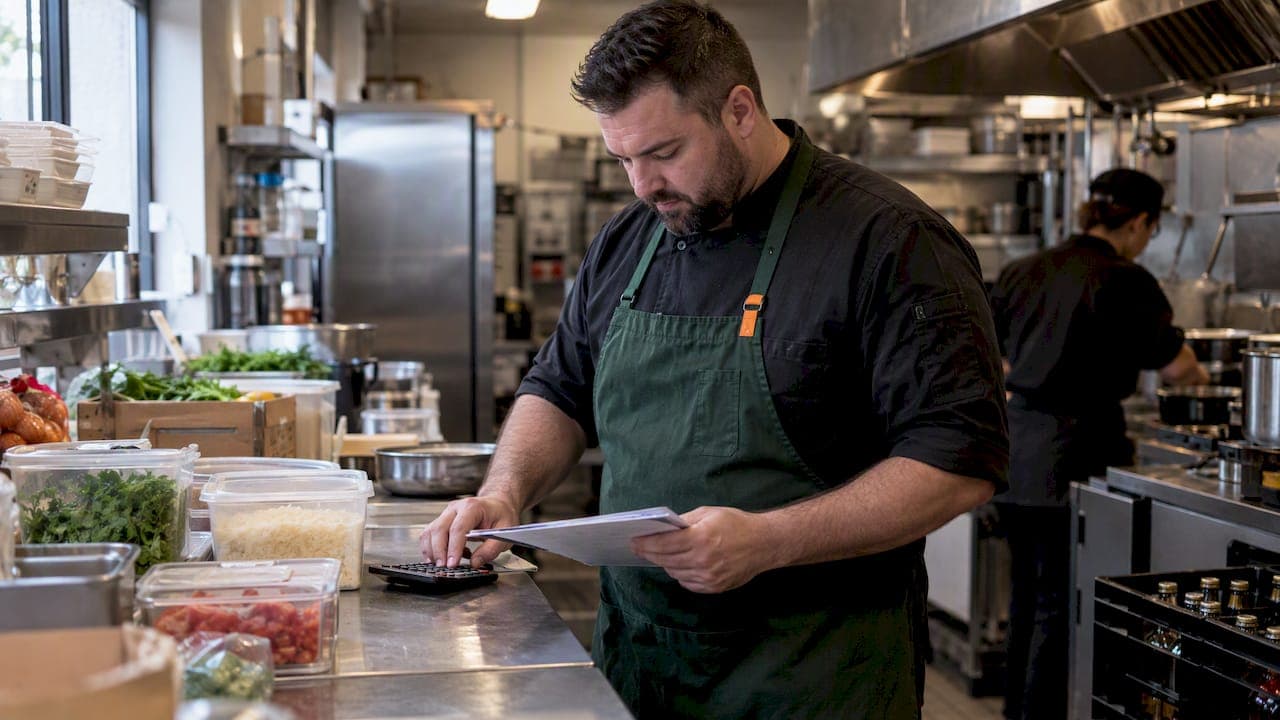
The inventory KPIs every restaurant needs to track are inventory turnover, sell-through rate, days on hand, inventory accuracy, inventory carrying cost, inventory-to-sales ratio, and lost sales ratio. Together, these numbers turn guesswork into control: they show you where cash sits on shelves, where waste creeps in, and where stockouts are quietly costing you sales.
TL;DR:
- Inventory turnover ratio varies greatly depending on the type of restaurant, with high-volume venues aiming for higher cycles, while specialty venues accept lower turnover.
- Maintaining an inventory accuracy rate above 95% is crucial, as discrepancies below this often indicate procedural issues rather than normal variance.
- Regular manual counts, at least monthly, help identify common issues like mis-shelved stock or theft that automated systems may not catch.
- Automating data collection from POS and supplier systems improves KPI accuracy and reduces manual errors, making daily stock management more reliable.
- Setting realistic KPI goals requires analyzing three to six months of historical data and adjusting targets seasonally to improve cost control and waste reduction.
Table of Contents
- Core inventory KPIs explained: definition, formula, how to read the number
- How to calculate KPIs in practice: worked examples and quick formulas
- Benchmarks and target ranges: how to set realistic KPI goals
- Inventory accuracy and reconciliation: practical controls
- Action plan: a 30-60-90 day rollout to start tracking inventory KPIs
- Author perspective: common pitfalls we've seen and what actually moves margins
- How an inventory platform can simplify KPI tracking
- FAQ
- Sources
Core inventory KPIs explained: definition, formula, how to read the number
Inventory turnover ratio measures how many times you sell and replace your stock over a given period. The formula is cost of goods sold (COGS) divided by average inventory value. A high ratio generally means you are moving product efficiently; a low ratio often points to overstocking, slow-moving menu items, or purchasing that is out of step with demand. Tracking COGS alongside turnover also strengthens your position when negotiating with suppliers, since you can show exactly how fast product moves through your kitchen.
Sell-through rate tells you what percentage of received stock you actually sell within a set period. For a high-volume menu item, this means dividing units sold by units received (or available) and multiplying by 100. A sell-through rate that keeps dropping for a specific ingredient is an early warning that a menu item is losing popularity, or that you are over-ordering relative to demand.
Days on hand converts turnover into a daily planning number: how many days your current stock will last at the current sales pace. This figure shapes your ordering cadence directly. If a perishable ingredient shows 10 days on hand, but your supplier's lead time is five days, you have breathing room; if it shows two days, you are at risk of a stockout before the next delivery.
Average inventory value and inventory carrying cost capture what it costs you to hold stock, not just buy it. Average inventory value includes the cost of ingredients, packaging, and any beverage or retail stock sitting in your storeroom or walk-in. Carrying cost adds in the extra expenses tied to holding that stock, including storage space, spoilage risk, and tied-up cash that could otherwise go toward payroll or rent.
Inventory accuracy compares what your system says you have against what a physical count confirms, expressed as a percentage. Low accuracy undermines every other KPI on this list, because turnover, days on hand, and carrying cost are only as reliable as the stock numbers feeding them.
Inventory-to-sales ratio and lost sales ratio round out the picture by flagging the two opposite failure modes: too much stock, or not enough. Inventory-to-sales ratio divides your inventory value by sales revenue over the same period, revealing overstock relative to what you are actually selling. Lost sales ratio estimates the share of demand you could not fulfill due to stockouts, which matters because inventory metrics in this category exist specifically to help you avoid stockouts and cut unnecessary costs at the same time.
- Inventory turnover ratio: COGS ÷ average inventory value, read as how many times stock cycles per period.
- Sell-through rate: units sold ÷ units received, read as how much of what you bought actually got used.
- Days on hand: average inventory ÷ average daily usage, read as how long current stock will last.
- Inventory accuracy: counted stock ÷ system stock, read as how trustworthy your data is.
How to calculate KPIs in practice: worked examples and quick formulas
Formulas only earn their keep when you can run them with your own numbers. Here is a simple walkthrough using illustrative figures, so you can swap in your own data.
- Inventory turnover: Say your monthly COGS is $18,000 and your average inventory value for that month is $6,000. Turnover equals $18,000 ÷ $6,000, or 3. That means you cycled through your inventory three times that month, which for many kitchens is a healthy pace for perishable stock.
- Days on hand from turnover: Take the number of days in the period (30) and divide by the turnover ratio. Here, 30 ÷ 3 gives you 10 days on hand, meaning your current stock level would last roughly 10 days at the current sales rate.
- Sell-through rate example: Imagine a popular pasta dish uses a specific sauce, and you received 100 units of that sauce this month but used 82. Sell-through rate is 82 ÷ 100 × 100, which comes to 82%. That is a strong number for a fast-moving ingredient; anything dropping well below that consistently is worth investigating.
- Spreadsheet setup: Build three columns pulling from your POS export (units sold, revenue by item) and two from your receiving log (units received, cost per unit). From there, turnover, sell-through, and days on hand are each a single division formula away.
For seasonal menus, calculate turnover and days on hand using a rolling average, either 13 or 26 weeks, rather than a single month. A rolling window smooths out short-term spikes from holidays or promotions so you are not overreacting to one unusually busy or slow week. If you want a deeper walkthrough of the turnover formula specifically, our guide on what inventory turnover ratio means breaks down more scenarios with worked numbers.
Benchmarks and target ranges: how to set realistic KPI goals
There is no single "correct" turnover ratio or days-on-hand target that fits every venue. A high-volume café moving fresh produce daily will look completely different from a steakhouse holding aged cuts for weeks, and a venue with a tight, simple menu will naturally show cleaner numbers than one running a sprawling multi-cuisine menu with dozens of specialty ingredients.
That said, a few general patterns hold across most restaurant formats:
- Turnover ratio: Faster-moving, perishable-heavy venues often aim for higher turnover (more cycles per month), while venues holding specialty or aged stock accept lower turnover by design.
- Days on hand: Perishables typically target a narrow band tied closely to delivery frequency, while shelf-stable goods can sit longer without concern.
- Inventory accuracy: Treat anything below the mid-90s as a signal to tighten counting procedures, since even well-implemented systems commonly show 95 to 98% accuracy, meaning a gap below that range usually points to a process issue rather than normal variance.
The most reliable way to set your own targets is to pull three to six months of your own historical data first, then set goals slightly better than your current average rather than copying a number from a different type of venue. Revisit targets each season, since reducing food waste and tightening these ranges often go hand in hand.
Inventory accuracy and reconciliation: practical controls
Automated systems are not perfect on their own. Physical shelf counts and regular reconciliation are essential because discrepancies between system counts and actual stock are common, even in well-run kitchens. Run full counts monthly at minimum, with cycle counts on your highest-value or highest-risk items weekly.
When counts do not match your system, look for the usual culprits: mis-shelved stock, invoices entered against the wrong item, portioning errors, or theft. Log every adjustment with a reason code and a name attached, since an undocumented adjustment tells you nothing the next time the same discrepancy appears. This kind of audit trail also makes it far easier to spot common inventory mistakes before they repeat month after month. Ingredient-level tracking and multi-location sync help here too, since they narrow down exactly where and when a discrepancy entered the system rather than leaving you to guess across an entire storeroom.

Pro Tip: Run a small-sample spot check weekly on your top 10 SKUs by cost, rather than waiting for a full monthly count to catch problems.
For a deeper look at how accuracy ties directly to your bottom line, our guide to inventory accuracy and restaurant profitability walks through the connection in more detail.
Action plan: a 30-60-90 day rollout to start tracking inventory KPIs
Rolling out KPI tracking works best as a staged plan rather than an overnight switch.
- Days 1 to 30: Run a full baseline stocktake, connect your POS to your inventory records, and pick the top 20 SKUs by cost or volume to pilot your new tracking process.
- Days 31 to 60: Automate data feeds for that pilot group, start producing weekly KPI reports, and investigate the discrepancies that show up most often.
- Days 61 to 90: Set formal targets based on your own baseline data, run an ABC analysis to separate high-control items from low-priority ones, and connect your reorder points to live stock levels so ordering triggers automatically.
Assign one person to own the KPI dashboard, even if the actual counting is a shared team task. Measure progress simply: is accuracy trending up, is waste trending down, and are stockouts on your top items becoming rarer?
Author perspective: common pitfalls we've seen and what actually moves margins
Training gaps cause more bad data than bad software ever does: a team that counts inconsistently will sink even the best system. Data quality beats data quantity every time, so a handful of accurate numbers outperforms twenty KPIs nobody trusts. Pick the three or four metrics that touch your biggest cost centers and work those relentlessly; tracking everything at once usually means tracking nothing well.
— Admin
How an inventory platform can simplify KPI tracking
Running these KPIs by spreadsheet is possible, but it is slow, and slow data means you catch problems a week after they started costing you money. We built PantryHub to close that gap: automated COGS and turnover reporting, low-stock alerts that fire before you run out, and multi-location dashboards that show every venue's numbers in one place.

That shift matters most for the accuracy and reconciliation work covered above, since ingredient-level tracking and synced counts across locations cut down the manual reentry that causes mismatches in the first place. Plans start with Starter at $39 AUD per month, scaling up through Regular at $69 and Pro at $99 depending on how many venues and features you need. If you want to see how it runs with your own numbers before committing, you can start a free trial today.
FAQ
What are the KPIs for restaurants?
The core inventory KPIs for restaurants are inventory turnover, sell-through rate, days on hand, inventory accuracy, inventory carrying cost, inventory-to-sales ratio, and lost sales ratio. These metrics cover cost control, waste reduction, and stockout prevention, which together shape most of a restaurant's day-to-day profitability.
How to calculate restaurant inventory?
Inventory value is typically calculated by multiplying the quantity on hand for each item by its most recent unit cost, then summing across all items. From there, metrics like turnover (COGS divided by average inventory value) and days on hand build directly on that base number.
What are the 5 key performance indicators?
For inventory specifically, the five most commonly prioritized KPIs are turnover ratio, days on hand, inventory accuracy, carrying cost, and sell-through rate. Starting with these five gives you a workable view of efficiency, cost, and stock health before adding more specialized metrics.
How often should I do a physical inventory count?
Run a full stocktake at least monthly, with weekly cycle counts on your highest-value or highest-risk items. Regular reconciliation matters because automated system counts commonly drift from actual stock due to mis-shelving, invoicing errors, or theft, so physical counts stay essential even with good software in place.
What causes most inventory discrepancies in restaurants?
The most common causes are mis-shelved stock, invoices logged against the wrong item, inconsistent portioning, and theft or shrinkage. Logging every adjustment with a reason helps you spot repeating patterns instead of treating each discrepancy as a one-off.
Sources
Every KPI on this list depends on clean, current data flowing from a handful of sources: your POS sales exports, supplier invoices, purchase orders, and physical stocktake counts. When these sources sit in separate spreadsheets, KPIs become a monthly chore instead of a daily signal.
Integrating your POS with your inventory system closes that gap. The key fields to map are item-level sales, ingredient usage per recipe, and unit costs from receiving, so that a sale automatically deducts the right ingredients from stock. A robust, integrated inventory system reduces manual entry errors and makes reports like sell-through rate and days of inventory remaining available without extra spreadsheet work.
Once the data flows automatically, prioritize automation in this order:
- Inventory management metrics: 14 KPIs to track (2025) - Shopify
Check daily dashboards for stockout risk and receiving mismatches, review weekly for sell-through trends, and reserve monthly reviews for turnover, carrying cost, and target-setting. If your current setup cannot support this rhythm, it may be worth reviewing the signs your kitchen needs inventory software, or a focused analytics tool like RESTOBOT's CRM and analytics dashboard for teams wanting a closer look at sales-side reporting alongside inventory data.