

Inventory variance analysis is the process of measuring the gap between what your records say you have and what's physically on your shelves, then tracing that gap back to its cause. The verdict, before anything else: don't adjust the books first. Freeze stock movement, run a blind recount to confirm the variance is real, then work through a structured root-cause investigation before you touch a single ledger entry.
TL;DR:
- Most variances are caused by clear operational issues such as receiving errors, picking mistakes, or transfer discrepancies, not theft or waste.
- Conducting a blind recount and narrowing transaction history windows is essential to verify that variance is real and identify its root cause.
- Standardized cause codes and scheduled follow-up counts improve the accuracy of investigations and prevent repeated errors.
- High-dollar and recurring variances should be prioritized; low-value, one-off discrepancies are often just noise.
- Automation platforms like PantryHub embed controls, dashboards, and mobile tools to transform variance analysis into daily operational routines.
Table of Contents
- What Is Inventory Variance Analysis and What Types Exist?
- Why Variance Analysis Matters for Margins and Audits
- How Do You Run a Root-Cause Analysis on Inventory Variance?
- Matching Common Causes to the Right Diagnostic Check
- Choosing a Reconciliation Cadence That Doesn't Burn Out Your Team
- Which Controls, KPIs, and Dashboards Prevent Repeat Variances?
- Investigation Checklist, Log Template, and Real Scenarios
- Where to Focus When You Don't Have Time to Fix Everything
- How PantryHub Turns These Controls Into a Daily Habit
- Sources
What Is Inventory Variance Analysis and What Types Exist?
Inventory variance is the difference between your book inventory (what the system says) and your physical inventory (what a count actually finds). Getting specific about which type of variance you're chasing determines where you look for the cause.
- Quantity variance — the unit count is wrong. You show 40 kilograms of chicken thighs in the system; the shelf has 34.
- Cost variance — the units are right, but the value posted per unit is wrong, often from a supplier price change that never got updated in the system.
- Timing variance — nothing is actually missing. A receipt, transfer, or invoice just hasn't posted yet, creating a "phantom" gap that resolves itself once the paperwork catches up.
The basic math is simple: variance units = book quantity minus physical quantity, and shrinkage percentage = (variance units ÷ book quantity) × 100. If you carry 200 units on paper and count 188, you're looking at a moderate shrinkage rate on that item, which is worth flagging for investigation on any moderately priced SKU.
Three measurement traps distort this number before you even start investigating. Unit-of-measure mismatches (cases counted as units, or kilograms confused with liters) create variances that look real but are actually arithmetic errors. Multi-location businesses often count one site's stock against a system total that includes stock in transit to another site. And work-in-progress or backflushed items (ingredients automatically deducted when a recipe is produced) can throw off raw counts if the bill of materials behind that backflush is inaccurate.
Why Variance Analysis Matters for Margins and Audits
Unresolved variance doesn't just sit quietly on a report. It distorts cost of goods sold, which means it distorts your margin on every dish or drink calculated from that COGS figure. A 3% unexplained shrinkage rate on a high-volume item can quietly erase the margin gain from a well-negotiated supplier deal.
Left unaddressed, variance also masks operational failures. A supplier consistently shorting deliveries by a case or two looks, on paper, like ordinary inventory noise until someone actually traces it. The operational fallout compounds from there: phantom stock triggers false confidence that leads to stockouts, while overstated counts on other items tie up cash in excess stock that never gets used before it spoils.
Auditors and finance teams also expect a paper trail. According to guidance on inventory variance accounts, standard costing systems post these gaps to dedicated variance accounts like purchase price variance, and any adjustment above a set threshold should trigger a documented root-cause review before it clears the books. Enterprise operations often target under 1 to 2% variance, but the more useful benchmark for most hospitality businesses is not a single universal accuracy percentage so much as how consistently variances get explained rather than just written off.
How Do You Run a Root-Cause Analysis on Inventory Variance?
A variance number tells you something is wrong. It never tells you why. That's what a structured RCA is for, and skipping straight to an adjustment entry is the single most common way operators waste the diagnostic value contained within every discrepancy.
Here's the five-step sequence, in order, and none of them are optional if you want an answer you can trust.
- Verify with a blind recount and freeze movement. Before you investigate anything, confirm the variance is real. Stop receiving, transfers, and picks on the affected SKU or location, then have a second person count without seeing the system figure. A large share of "variances" turns out to be counting errors that a fresh, blind count resolves in minutes.
- Pull the transaction history and narrow the time window. Gather every receipt, transfer, pick, adjustment, and supplier invoice touching that item. Narrow to the shortest window since the last confirmed accurate count. The tighter the window, the fewer suspects you're chasing.
- Segment by SKU and location, then assign a tentative cause code. Variance clustered around one location or one item points to a systemic issue, not random error. Practitioner guidance from Xero's inventory management resources notes that patterns by SKU or location are usually the clearest signal of a process breakdown, like mislabeling or a bill-of-materials error, rather than isolated theft or accident.
- Interview the people involved and check physical evidence. Talk to receiving staff, pickers, or line cooks who touched the item in that window. Check labels, photos of delivered stock, and any open goods-received/invoice-received items sitting unposted. Timing mismatches between a receipt and its matching invoice are a frequent source of apparent shortages that aren't shortages at all.
- Apply the fix, log it, and schedule a follow-up count. Correct the underlying process, not just the number. Record the reason code, the corrective action taken, and set a follow-up count date to confirm the fix actually held.
Pro Tip: Before you assume theft or waste, always rule out timing first. Check for unposted receipts, invoices sitting in a "goods received, not yet invoiced" queue, and transfers still in transit. Timing mismatches are commonly the largest source of variance that isn't actually a loss at all.
This sequence mirrors the reconciliation loop described in guidance on inventory reconciliation procedures: plan, count, compare, investigate, correct, then review the controls that let the gap open in the first place. Skip that last step and you'll be running the same investigation again next month, on the same SKU.
Matching Common Causes to the Right Diagnostic Check
Most variances trace back to one of five operational sources, and each one leaves a distinct fingerprint if you know where to look.
- Receiving errors: compare the purchase order, the advance shipping notice or packing list, and the actual dock count side by side. A supplier that consistently ships one unit short is a pattern, not bad luck.
- Picking errors: review pick logs and scan rates for wrong-bin pulls, especially among SKUs that look alike on a shelf. Two similarly packaged items sitting next to each other are a near-guaranteed source of recurring mix-ups.
- Transfer and WIP issues: check backflush logs and bill-of-materials accuracy, along with any transfers between locations that were physically moved but never posted in the system.
- Counting errors: verify unit-of-measure consistency across receiving, picking, and counting. A fixed-ratio variance that repeats at the same percentage every count usually means someone is counting cases where the system expects units, or liters where it expects milliliters.
- Shrinkage and loss: look for a repeating pattern by shift, location, or item, and cross-check against access logs or camera footage where available, along with the adjustment history for that SKU.
Unit-of-measure mismatches deserve extra attention because they're easy to miss and expensive once they compound. Printing the conversion ratio directly on the storage label, alongside standardizing UoM across every stage from receiving to counting, closes off one of the most persistent sources of "unexplained" variance before it ever becomes a mystery.
Choosing a Reconciliation Cadence That Doesn't Burn Out Your Team
Not every item deserves the same counting attention, and treating them all equally is how counting programs collapse under their own workload. ABC classification solves this by sorting inventory into tiers based on dollar impact, then assigning count frequency accordingly.
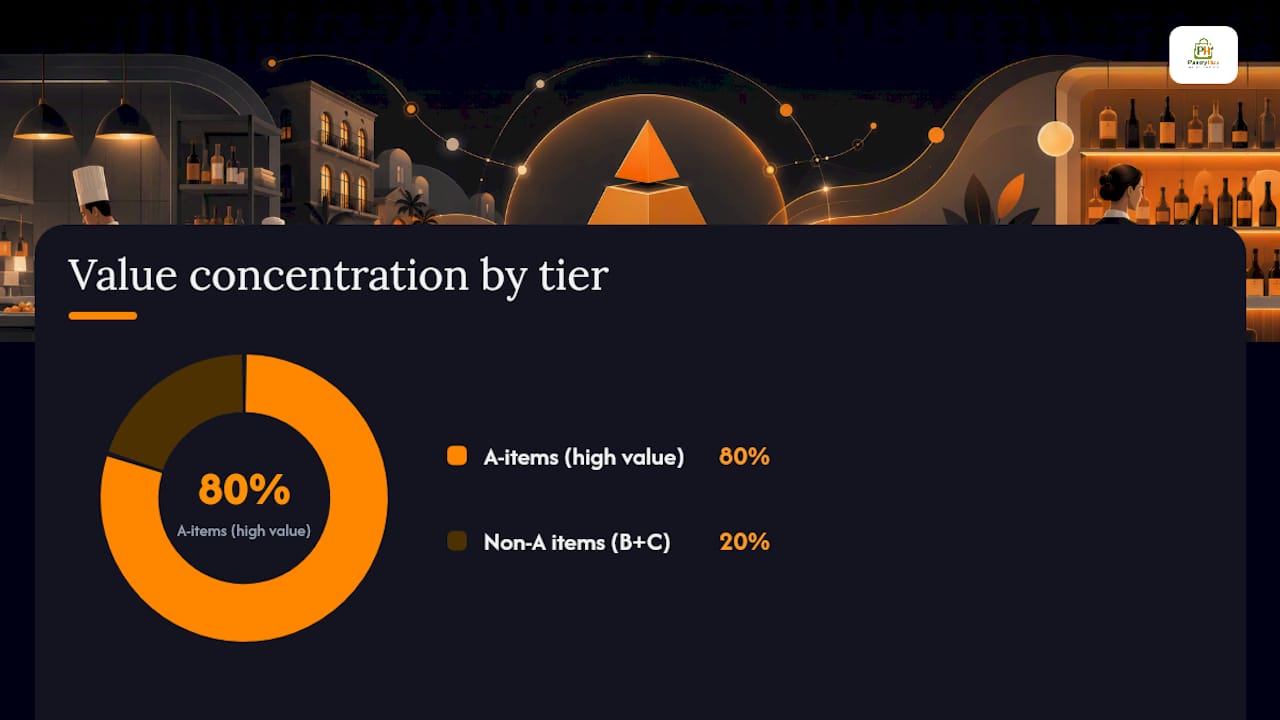
- A-items (high dollar value, often 20% of SKUs driving 80% of value): count weekly, or even daily for perishable high-cost proteins and premium liquor.
- B-items (moderate value): count every two to four weeks.
- C-items (low-value, high-volume staples): count monthly or quarterly, since the dollar risk of a miss is small.
Blind counts, where the counter doesn't see the system quantity before counting, catch confirmation bias that a sighted count misses almost every time. Pair that with a recount threshold: any item variance above a set dollar or percentage figure automatically triggers a second count before anyone touches an adjustment entry, which stops small counting slips from becoming logged "shrinkage" that then gets investigated for the wrong reason.
Cadence should scale with business size and SKU complexity rather than following a one-size formula. A single café with 150 line items can run a full ABC-weighted cycle count in a morning. A multi-location group with thousands of SKUs across kitchens and bars needs a rolling schedule where every location touches its A-items weekly without ever attempting a full count of everything at once. Scanning tools cut recount loops significantly here, since a barcode or QR scan removes the transcription errors that manual tally sheets introduce at almost every count.
Which Controls, KPIs, and Dashboards Prevent Repeat Variances?
Controls only work if they're specific enough to follow under pressure on a busy shift. The essentials: mandatory scans at receiving and transfer points, a labeling standard that includes unit-of-measure conversions, and segregation of duties so the person counting stock isn't the same person authorized to approve the adjustment. A reason code attached to every single adjustment, no exceptions, turns what would otherwise be a black box of write-offs into a dataset you can actually analyze for patterns.
Approval thresholds should scale with dollar impact. A $15 discrepancy on a case of napkins doesn't need a manager's sign-off. A $400 discrepancy on premium spirits does, and it should require dual sign-off before it clears, per the materiality threshold guidance that finance teams apply to prevent chronic losses from getting quietly reclassified as routine noise.
| KPI | What it measures | Suggested target |
|---|---|---|
| Inventory accuracy % | Physical count matching book quantity | 98% to 99% with disciplined reconciliation |
| First-pass count accuracy | Counts requiring no recount | Track trend, aim for steady improvement |
| Variance $ by SKU/location | Dollar impact concentrated by item or site | Monitor top variance items weekly |
| Recount rate | Share of counts triggering a second count | Falling trend signals process improvement |
A dashboard built around this data should surface a variance heatmap by SKU and location, a trendline showing whether accuracy is improving or slipping month over month, and the recount rate itself, since a persistently high recount rate usually points to a training gap rather than a counting fluke. Reconciliation programs that pair this kind of tracking with scanning and reason-code discipline can push accuracy above 98 to 99% once the habit sticks.
Investigation Checklist, Log Template, and Real Scenarios
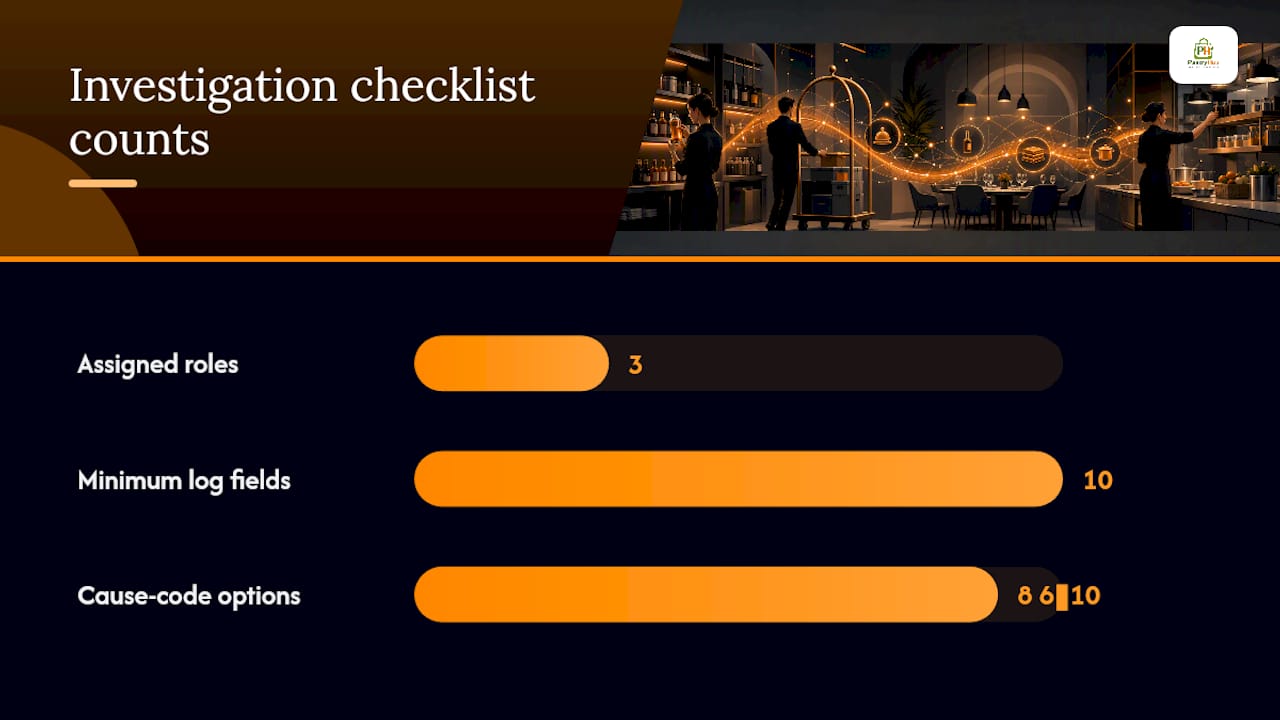
A recount is only useful if it's structured the same way every time. Before you start, assign three roles: a counter, a verifier, and someone with authority to freeze movement on the affected item or zone.
- Confirm the count window and freeze all receiving, transfers, and picks on the affected SKU.
- Use a blind count sheet, no visible system quantity.
- Log item, location, unit value, delta, and tentative cause code immediately.
- Escalate anything above your dollar threshold for a second review before adjusting.
A workable variance log needs, at minimum: date, SKU, location, book quantity, physical quantity, delta, unit cost, dollar impact, tentative cause code, and resolution status. An example entry might read: 03/14, Chicken Thigh 5kg, Kitchen 2, book 40, physical 34, delta 6, $8.20/unit, $49.20, cause: pending recount, status: open.
Three quick scenarios show the pattern in action. A receiving shortage shows up as a repeated small delta on the same supplier's deliveries, resolved by comparing the packing list against the dock count going back several deliveries. A bill-of-materials mismatch shows up as a raw-ingredient variance that grows steadily every time a specific recipe runs, traced back to an outdated recipe yield in the system. A unit-conversion error shows up as a fixed-percentage variance that repeats identically every count, resolved by standardizing the UoM label at the point of storage. Guides like Pantryhub's stock discrepancy walkthrough and its stock count sheet template offer hospitality-specific formats for exactly this kind of log.
Pro Tip: Keep your cause codes short and standardized, no more than eight to ten options, so staff actually use them consistently instead of typing free-text notes that no one can analyze later.
Where to Focus When You Don't Have Time to Fix Everything
Most operations can't investigate every variance to the same depth, so the priority is high-dollar items and anything that repeats. A $6 variance on paper napkins once is just noise. A $200 variance on the same liquor SKU three cycles running is a process failure wearing a disguise, and it deserves your attention before the next new problem does.
Assign one person as the inventory accuracy owner and restrict who can post adjustments. Without that, reason codes become decorative rather than diagnostic, and the whole discipline collapses back into guesswork within a quarter.
The biggest failure mode isn't bad counting. It's running RCA as a special event instead of folding it into the regular cycle-count cadence, which is how backlogs form and teams quietly stop investigating anything below a rising threshold.
— Admin
How PantryHub Turns These Controls Into a Daily Habit
Every control described above, scanning at receiving, reason codes on adjustments, dollar-based approval thresholds, a variance heatmap by SKU and location, is exactly what PantryHub's hospitality inventory platform is built to run automatically instead of on a spreadsheet someone forgets to update.

If you're running a bar program, PantryHub's bar inventory tools track pour cost and stock counts together, so a liquor variance surfaces alongside the pour-cost trend that usually explains it. Multi-location groups can use a centralized dashboard across every kitchen instead of managing separate spreadsheets per site, and low-stock alerts help catch developing shortages before they become stockouts during service. For teams that want mobile scanning on the floor rather than a clipboard, the PantryHub kitchen inventory app handles counts from a phone, cutting the transcription errors that manual tally sheets introduce.
Start a free trial and run your next cycle count through PantryHub to see how much of this RCA playbook it handles for you before you type a single adjustment entry yourself.
Sources
- What is inventory control? Complete guide to methods, types & systems
- Guide to inventory variance account: Definition, entries, and best practices
- Inventory management guide (Xero)