
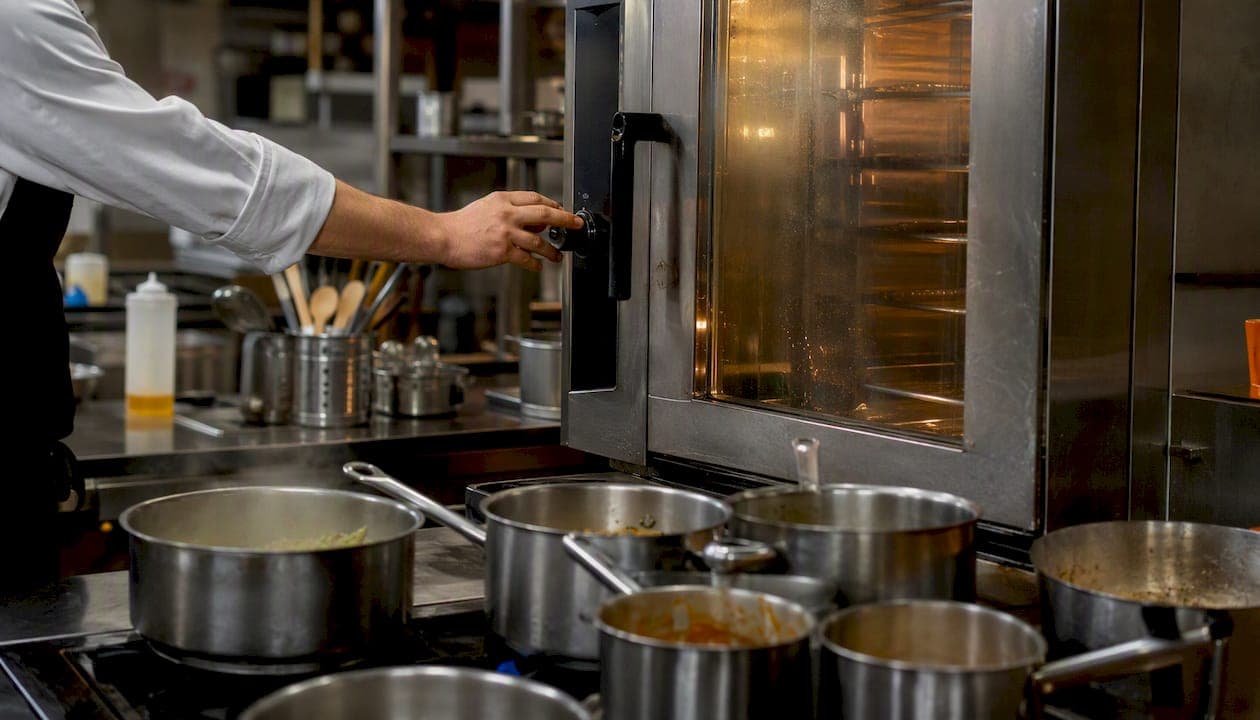
The most common examples of kitchen inefficiency problems in commercial kitchens fall into ten categories, each with a direct cost in time, waste, or safety risk. Here is your rapid-scan list — check which ones apply to your operation before reading further.
- Equipment breakdowns mid-service. A single fryer or combi oven failure can stall an entire section. First check: when was the last scheduled service?
- Poor extraction and ventilation. Reduced capture velocity means heat, smoke, and grease accumulate fast. First check: are filters cleaned weekly?
- Inconsistent refrigeration. Temperature drift above safe thresholds risks food safety compliance and spoilage. First check: review the last 7 days of temperature logs.
- Drainage and plumbing faults. Slow drains during peak service create hygiene hazards and slow the dishwash section. First check: is there standing water after a rush?
- Unreliable gas, electrical, or hot-water supply. Voltage fluctuations and gas pressure drops cause inconsistent cook times. First check: note any pilot light or trip-switch incidents this month.
- Inefficient layout and workflow bottlenecks. Poor station layout, prep delays, and excess manual handling raise labor costs and slow ticket times. First check: count how many steps a cook takes from prep to pass.
- Inventory and ordering failures. Overordering leads to expiry waste; underordering causes stockouts and menu outages. First check: how many items were 86'd last week?
- Grease buildup in ducts and filters. Beyond fire risk, heavy grease reduces hood efficiency and raises energy use. First check: pull a filter and inspect it now.
- Staffing, training, and process gaps. Mis-portioning and slow mise en place compound under pressure. First check: is there a written portion guide at every station?
- Menu and layout mismatch. When a menu is not finalized before design, layouts are guessed and equipment is frequently mis-sized, creating bottlenecks that persist for years. First check: does your current menu match the stations you have?
Key Takeaways
The most impactful kitchen inefficiency problems share a small set of root causes: deferred maintenance, ad hoc ordering, and layouts that were never matched to the menu.
| Point | Details |
|---|---|
| Fix safety and compliance first | Ventilation, refrigeration, and grease buildup carry the highest risk and must be addressed before process improvements. |
| Use data, not gut feel | Track ticket time, waste percentage by item, and stockout rate weekly to prioritize fixes with real cost attached. |
| Menu-first design prevents structural waste | Finalizing the menu before layout decisions avoids equipment mis-sizing and workflow bottlenecks that training cannot fix. |
| Process fixes before capital spend | Run a 30-day process pilot before approving equipment purchases; measurable improvement justifies or eliminates the spend. |
| Pantryhub for inventory-driven inefficiency | Real-time stock tracking and automated low-stock alerts replace manual counts and reactive ordering for commercial kitchens. |
Table of Contents
- 1. Equipment failures during service
- 2. Poor ventilation and grease extraction
- 3. Inconsistent refrigeration and cold-chain failures
- 4. Drainage and plumbing faults
- 5. Unreliable gas, electrical, and hot-water supply
- 6. Inefficient layout and workflow bottlenecks
- 7. Inventory and ordering failures
- 8. Grease buildup in ducts and filters
- 9. Staffing, training, and process gaps
- 10. Menu and layout mismatch
- How to spot and measure kitchen inefficiency during a shift
- Root causes that drive multiple inefficiencies at once
- An inventory-driven inefficiency: a remediation example
- Your 30/90/180-day action plan
- Communication breakdowns that slow your kitchen down
- Scheduling and shift planning gaps that hurt service speed
- Waste management beyond procurement
- How inconsistent cleaning schedules create health and operational risks
- Why auditing your kitchen is worth more than you think
- Inventory and ordering inefficiency? Pantryhub addresses it directly
- Sources
1. Equipment failures during service
How it shows up: A combi oven trips mid-lunch, a fryer thermostat fails, or a dishwasher stops heating. The section either halts or improvises, stretching ticket times across the board.
Root causes: Deferred preventive maintenance, no service log, and running equipment beyond its rated duty cycle.
Quick fix: Cross-train one cook per section to handle the most likely single-point failure (e.g., switching to a backup burner or holding in a bain-marie). Keep a laminated emergency substitution card at each station.
Prevention: Schedule quarterly manufacturer-recommended services. Log every fault, even minor ones, so patterns appear before a full breakdown occurs.
Manager actions: Assign a maintenance lead per section; set a monthly review of the fault log; target zero unplanned equipment outages per service week within 90 days.
Note: Using aluminum foil to line oven bottoms disrupts heat circulation and can damage heating elements, requiring costly recalibration. Brief your team on equipment misuse as part of onboarding.
2. Poor ventilation and grease extraction
How it shows up: Smoke lingers over the line, the kitchen runs hot, and grease coats surfaces faster than cleaning schedules can handle.
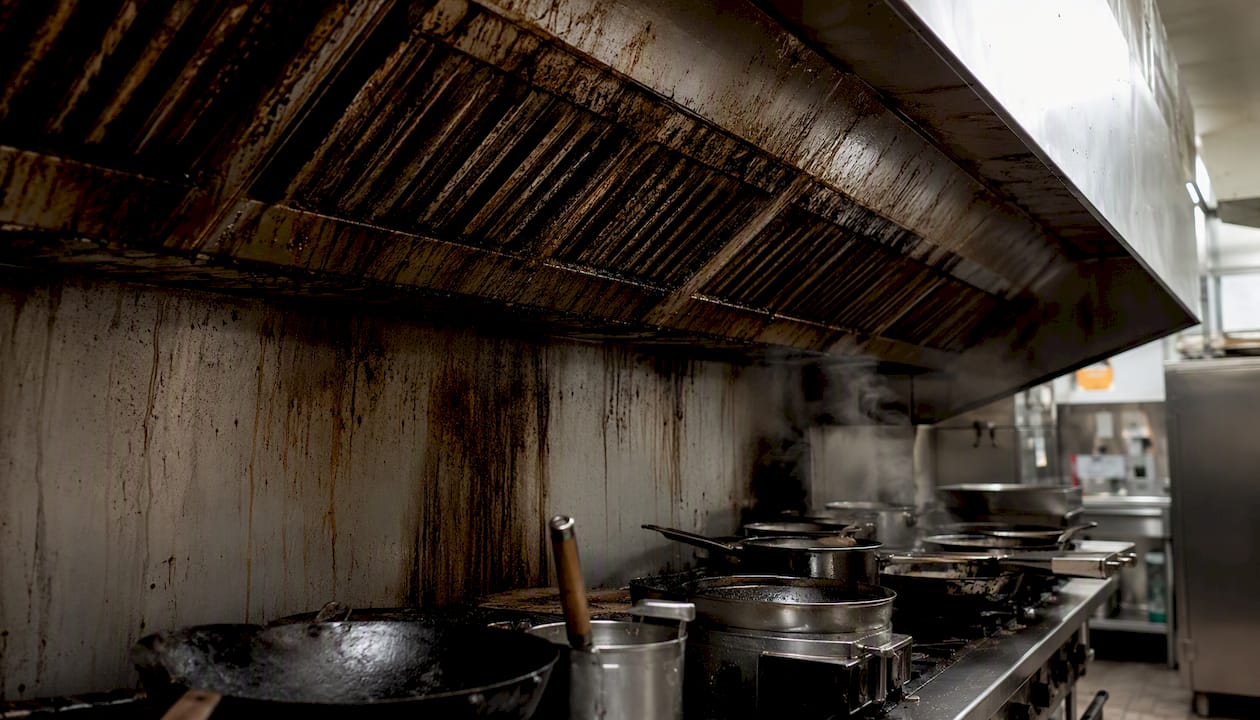
Root causes: Hood-to-duct misalignment beyond tolerance reduces capture velocity and accelerates grease buildup, raising both fire risk and energy consumption.
Quick fix: Clean or replace filters immediately. Check that the hood sits directly above cooking equipment with no lateral offset.
Prevention: Weekly filter cleaning, quarterly duct inspection, and an annual compliance check against your local fire and health authority standards. Log every inspection with a date and inspector name.
Manager actions: Assign a weekly filter check to a named team member; photograph duct condition quarterly; target zero grease-related compliance notices per year.
3. Inconsistent refrigeration and cold-chain failures
How it shows up: Walk-in temperatures drift above 5°C, product near the door spoils faster, and staff don't notice until a food safety audit or a batch of protein is condemned.
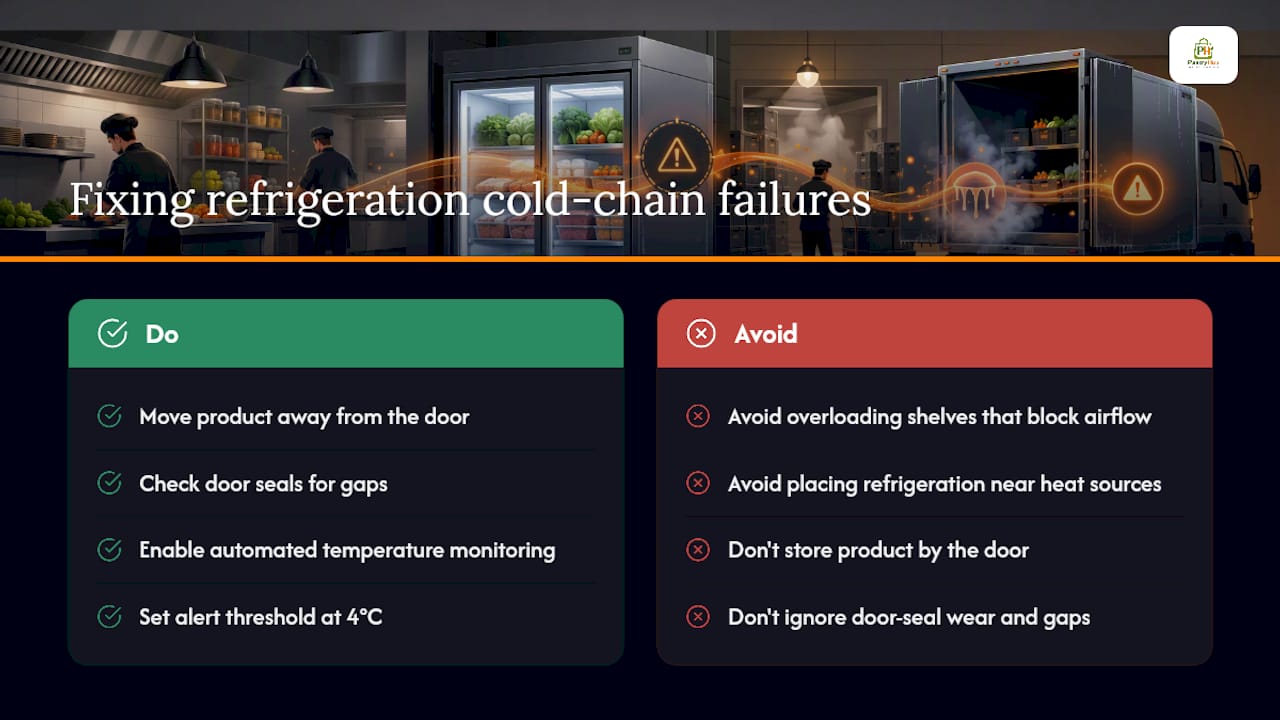
Root causes: Overloaded shelves blocking airflow, door seals worn out, refrigeration units placed near heat sources. Misplacing refrigeration adjacent to heat-generating equipment raises energy use and repair frequency.
Quick fix: Move product away from the door, check door seals for gaps, and log temperatures manually every four hours until the unit stabilizes.
Prevention: Automated temperature monitoring with alerts, monthly seal inspections, and a clear load-limit guide posted inside each unit.
Manager actions: Assign temperature log review to a supervisor each morning; set an alert threshold at 4°C so corrective action happens before the legal limit is breached.
4. Drainage and plumbing faults
How it shows up: Slow floor drains during peak service, grease traps overflowing, or a blocked pot-wash sink that backs up the dishwash section.
Root causes: Infrequent grease trap pumping, food debris bypassing drain screens, and ageing pipe infrastructure.
Quick fix: Clear drain screens before every service. If a trap is overdue, pump it immediately rather than waiting for the scheduled date.
Prevention: Post a grease trap pumping schedule on the wall. Assign drain screen clearing to the opening checklist, not the closing one, so it is done before service pressure builds.
Manager actions: Add drain inspection to the weekly walk-through; track grease trap pump dates in a maintenance log; target zero drainage-related service interruptions per quarter.
5. Unreliable gas, electrical, and hot-water supply
How it shows up: Pilot lights re-ignite repeatedly, circuit breakers trip during peak load, or hot water pressure drops mid-service, slowing dishwash and hand-hygiene compliance.
Root causes: Aging infrastructure, overloaded circuits from added equipment, and no load-balancing plan when new appliances were installed.
Quick fix: Identify which circuits are overloaded and stagger high-draw equipment start-up times. For gas, check regulator pressure against the manufacturer's spec.
Prevention: Commission an electrical load audit when adding any new equipment. Keep a licensed plumber and electrician on a service retainer so response times are predictable.
Manager actions: Document every trip or pilot-light incident with time and equipment; escalate to a licensed contractor if incidents exceed two per month.
6. Inefficient layout and workflow bottlenecks
How it shows up: Cooks backtrack across the kitchen to retrieve ingredients, the pass becomes a traffic jam during plating, and prep and service compete for the same bench space.
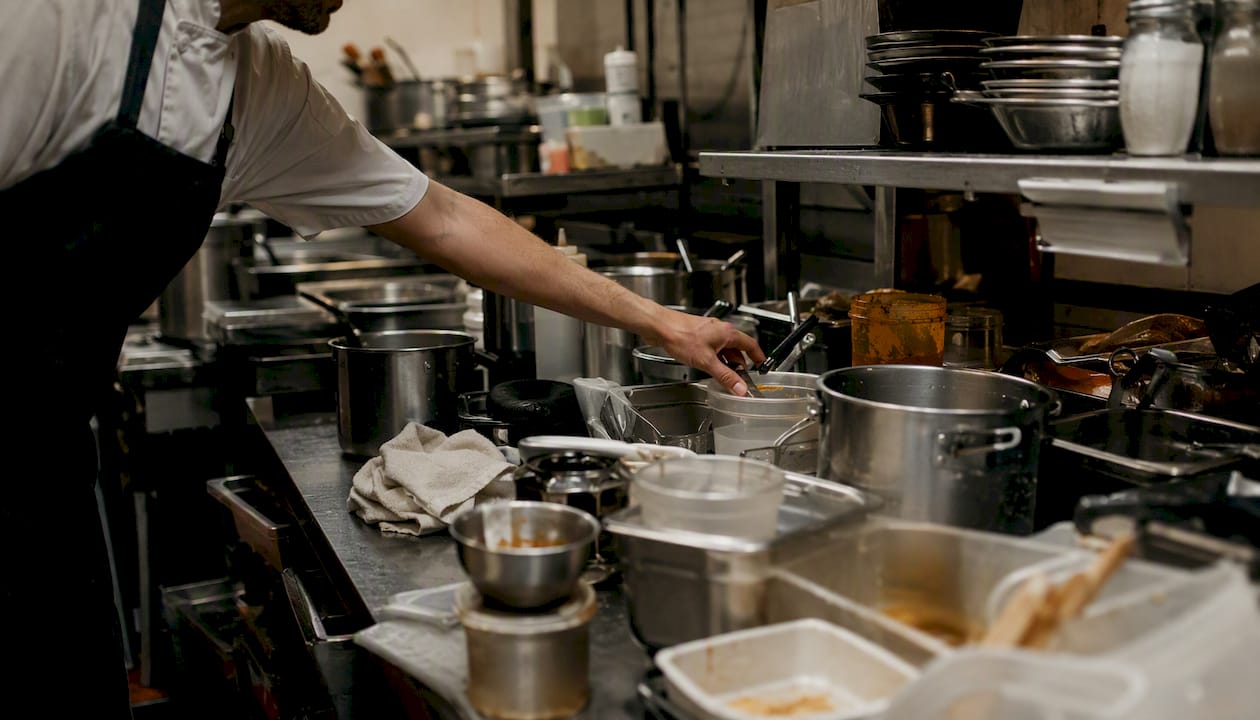
Root causes: Signs of inefficient workflows include excessive backtracking, "mystery zones" where tools disappear, using the wrong tools, and prep taking longer than cooking. These patterns often trace back to a layout designed without the final menu in mind.
Quick fix: Map the five most frequent movement paths during a service. Relocate the two most-used items to within arm's reach of where they are used.
Prevention: Apply a "5-second placement" rule: any item used more than ten times per service should be reachable in under five seconds. Visual clutter and decision fatigue materially increase task time; simple placement rules reduce friction and errors.
Pro Tip: Run a 15-minute "shadow audit" during a mid-week service. Follow one cook from mise en place to plating and note every unnecessary movement. You will find at least two quick wins before the shift ends.
7. Inventory and ordering failures
How it shows up: High-cost proteins expire before use, the kitchen runs out of a key ingredient mid-service, and orders are placed reactively rather than against par levels.
Root causes: No cycle-count discipline, ordering based on memory rather than data, and no low-stock alerts. Common inventory mistakes compound quickly when procurement is ad hoc.
Quick fix: Count the top ten highest-cost items daily for one week to establish a baseline. Place orders against that baseline, not against gut feel.
Prevention: Set par levels for every SKU. Automate low-stock alerts so ordering happens before a stockout, not after. Review cafe ordering workflow best practices to build a repeatable process.
Manager actions: Assign daily counts to a named team member; track stockout incidents per week; target fewer than two stockouts per week within 30 days.
8. Grease buildup in ducts and filters
How it shows up: Filters are visibly saturated, airflow is reduced, and the kitchen smells of old grease even after cleaning. In a worst case, a duct fire starts during a busy service.
Root causes: Cleaning frequency set by calendar rather than by cooking volume, and no visual inspection protocol between scheduled cleans.
Quick fix: Pull and clean or replace all filters today if they have not been checked in the past seven days. Inspect the duct collar for visible grease accumulation.
Prevention: Tie filter cleaning frequency to covers served, not just the calendar. High-volume kitchens may need filter cleaning two to three times per week. Log every clean with a date and staff member's name for compliance records.
Manager actions: Add a filter inspection photo to the weekly compliance report; escalate to a duct-cleaning contractor if buildup is visible beyond the first 300mm of duct.
9. Staffing, training, and process gaps
How it shows up: Portion sizes vary between cooks, mise en place is incomplete at service start, and new staff slow the line because processes are not written down.
Root causes: No written standard operating procedures, verbal-only training, and no portion-weight verification at the pass.
Quick fix: Post laminated portion guides and prep checklists at every station. Weigh three random portions per service for one week to establish actual variance.
Prevention: Build a short onboarding checklist for every station. Run a monthly 10-minute process review with the team to catch drift before it becomes habit. Training your kitchen team on new software and processes follows the same principle: written steps, supervised practice, and a feedback loop.
10. Menu and layout mismatch
How it shows up: A section is perpetually behind because the equipment capacity does not match the menu's demand, or the prep area is too far from the cooking section for the dishes being produced.
Root causes: Designing the kitchen before finalizing the menu causes mis-sized equipment, guessed layouts, and workflow compromises that slow service and reduce consistency. This is one of the most expensive structural inefficiencies because it cannot be fixed with training alone.
Quick fix: Identify the two highest-volume menu items and check whether the equipment and station layout actually support their production at peak covers. If not, that is your first capital or process case.
Automation and programmable equipment improve speed and consistency but must align with menu and volume to avoid creating a new bottleneck.
Manager actions: Map current menu items to current stations; flag any station where throughput capacity is less than peak demand; present findings to ownership within 30 days.
How to spot and measure kitchen inefficiency during a shift
The essential KPIs
Track these six metrics weekly to convert gut feel into data:
- Ticket time and ticket variance — average time from order to pass, and the spread between fastest and slowest tickets in a service.
- Waste percentage by item — weigh waste by category daily for two weeks to find your highest-cost losses.
- Refrigeration temperature variance incidents — count how many times a unit logs above threshold per week.
- Emergency maintenance incidents per month — any unplanned repair during service counts.
- Stockout rate — number of 86'd items per week, tracked by category.
- Energy spikes — flag any billing period where consumption rises more than 10% without a corresponding increase in covers.
Over a year, that single line item costs more than $3,000 before you account for the labor that prepared it.
One-shift audit checklist
Run this in sequence during a single service:
- Receiving: Are delivery temperatures logged? Is product dated and rotated FIFO on arrival?
- Storage: Are walk-in temperatures within range? Are shelves organized by use frequency?
- Prep: Is mise en place complete 30 minutes before service? Are portion weights being checked?
- Line: Are tools within arm's reach? Is there backtracking to retrieve common items?
- Pass: Is plating consistent? Are tickets backing up at one station specifically?
- Dishwash: Is the section keeping pace, or is it creating a bottleneck for clean equipment?
- Waste bins: Are bins sorted correctly? Is food waste being weighed and recorded?
Prioritization rubric
Triage fixes using two axes: frequency (how often does this problem occur?) and cost impact (what does it cost per incident in time, waste, or compliance risk?). Fix high-frequency, high-cost problems first. Low-frequency, low-cost problems go on a watch list, not the urgent action plan.
Root causes that drive multiple inefficiencies at once
Most of the ten problems above share a small set of structural causes. Fix the root cause and you often resolve two or three surface problems simultaneously.
Menu not finalized before layout decisions. This single error generates equipment mis-sizing, station bottlenecks, and workflow compromises that persist for the life of the fit-out. It is the most expensive root cause to fix after the fact.
No preventive maintenance program. Ad hoc repairs cost more per incident than scheduled services and create unpredictable service disruptions. A maintenance calendar with assigned owners is a low-cost fix with compounding returns.
Ad hoc procurement. Ordering without par levels or cycle counts produces both overstock (expiry waste) and understock (stockouts). Neither is visible until it is already costing money.
Unclear roles and verbal-only processes. When responsibilities are not written down, tasks fall through the gaps during high-pressure services. This drives both staffing inefficiency and communication breakdowns.
Poor thermal and spatial zoning. Refrigeration near heat sources, hoods misaligned with cooking equipment, and prep areas separated from cooking sections all create hidden energy and labor costs.
When to escalate to capital spend
Use process and training fixes first. Escalate to capital expenditure when:
- A compressor is running at high duty cycle consistently and repair costs have exceeded 50% of replacement value in the past 12 months.
- Stockouts exceed three per week despite correct par levels and ordering discipline, indicating that storage capacity is the constraint.
- Ticket times remain above target after layout adjustments and training, pointing to equipment throughput as the bottleneck.
Pro Tip: Before approving any capital spend, run a one-month process-fix pilot first. If they do not move, the data justifies the spend.
An inventory-driven inefficiency: a remediation example
A mid-size restaurant running 200 covers per night identified a recurring problem: weekly inventory counts were done by memory and verbal confirmation, not by physical count. The result was a pattern of overordering on slow-moving items (leading to expiry waste) and underordering on high-velocity proteins (leading to menu outages two to three times per week).
Remediation steps taken:
- Introduced daily cycle counts on the top 15 SKUs by cost.
- Set par levels and reorder points for each SKU based on four weeks of actual usage data.
- Consolidated orders to two supplier contacts per category, reducing the number of ad hoc calls.
- Reviewed the menu against current station capacity, finding that two dishes required equipment the kitchen did not have at sufficient volume.
Outcomes after 60 days: Menu outages dropped from two to three per week to fewer than one. Expiry waste on slow-moving items fell measurably. The team spent less time on reactive ordering and more time on prep.
Sample reorder-rule table (adapt par levels to your own usage data):
| SKU Category | Par Level (units) | Reorder Point (units) | Order Quantity | Review Frequency |
|---|---|---|---|---|
| High-cost protein (e.g., beef fillet) | 8 kg | 3 kg | 6 kg | Daily |
| Dry goods (e.g., pasta) | 10 kg | 4 kg | 8 kg | Weekly |
| Dairy (e.g., cream) | 6 L | 2 L | 5 L | Daily |
| Produce (e.g., leafy greens) | 4 kg | 1.5 kg | 3 kg | Daily |
Implementation checklist for managers:
- Identify your top 15 SKUs by weekly cost.
- Run a physical count on day one to establish a true baseline.
- Set par and reorder points using four weeks of purchase data.
- Assign daily count responsibility to a named team member.
- Review count accuracy weekly for the first month.
- Measure stockout incidents and expiry waste weekly against the pre-pilot baseline.
Pro Tip: Menu-first design reduces inventory complexity because it limits the number of SKUs you need to manage. Before adding a new dish, check whether it introduces a new SKU or reuses existing ones. Reuse wins every time.
Your 30/90/180-day action plan
Days 1–30: Stop the bleeding
- Run the one-shift audit checklist above and score each of the ten inefficiency categories.
- Fix all safety and compliance issues immediately (ventilation, refrigeration, grease buildup, drainage).
- Post portion guides and prep checklists at every station.
- Start daily cycle counts on your top 15 SKUs by cost.
- Log every equipment fault and maintenance incident from this point forward.
Expected outcomes: Fewer compliance risks, a baseline dataset for waste and ticket time, and at least two quick-win process fixes in place.
Cost bucket: Low (printed materials, staff time, minor consumables).
Days 31–90: Build the system
- Set par levels and reorder points for all counted SKUs.
- Implement a weekly filter-cleaning and temperature-log review.
- Run a layout walk-through with your head chef: identify the top three backtracking patterns and fix them.
- Introduce a structured 5-minute station reset between service periods.
- Assign a maintenance lead and schedule the first quarterly equipment service.
Expected outcomes: Reduced stockout rate, measurable improvement in ticket variance, and a functioning maintenance calendar.
Cost bucket: Low to medium (minor equipment repositioning, possible filter replacement, contractor service call).
Days 91–180: Invest where the data points
- Review 90 days of fault logs and waste data to build the capital expenditure case (if any).
- Evaluate whether equipment throughput or storage capacity is the binding constraint.
- If inventory management is still a primary pain point, assess whether a purpose-built hospitality inventory platform would reduce the manual count burden and improve ordering accuracy.
- Run a menu-to-layout alignment review: does the current menu match the stations and equipment you have?
- Present a prioritized capital plan to ownership with data-backed ROI estimates.
Expected outcomes: A clear picture of which problems are process-solvable and which require capital, with data to support the decision.
Cost bucket: Medium to higher (equipment retrofits, possible layout changes, software subscriptions).
Communication breakdowns that slow your kitchen down
Poor communication is one of the most common kitchen workflow issues, yet it rarely appears on a maintenance checklist. The most frequent examples: a cook calls an 86 verbally but the front-of-house team does not hear it, so the dish is still being sold; a prep list is written on a whiteboard that gets wiped before the second shift reads it; a ticket is called but the grill cook is at the cold section and misses it.
These breakdowns share a common structure: information exists in one person's head or one physical location and does not transfer reliably. The fix is rarely about communication skills. It is about building systems where critical information is visible, persistent, and confirmed. A printed 86 board updated in real time, a shared digital prep list, and a clear call-and-confirm protocol at the pass each solve a specific failure mode without requiring a culture change.
The cost of these gaps shows up in re-fires, comped dishes, and extended ticket times. A single re-fire on a high-cost protein during a busy service can erase the margin on three or four covers.
Scheduling and shift planning gaps that hurt service speed
Understaffing a peak shift is the most obvious scheduling failure, but it is rarely the most damaging one. The subtler version: scheduling the right number of bodies but putting an inexperienced cook on the section that carries the most volume during that specific service. A Friday dinner with a full grill section run by a cook who primarily works prep is a structural mismatch, not a staffing shortage.
A second common pattern: no overlap between closing and opening shifts, so the opening team arrives to an incomplete mise en place and spends the first 45 minutes catching up instead of being ready for an early lunch rush. Building a 20-minute handover window into the schedule costs less than the ticket-time blowout it prevents.
Track which shifts consistently produce the longest ticket times or the most re-fires. The pattern almost always points to a scheduling decision, not a random bad night.
Waste management beyond procurement
Most waste conversations focus on over-ordering, but disposal inefficiencies create their own operational drag. Bins that fill during service and are not emptied create hygiene risks and slow the dishwash section. Recycling and general waste mixed together can trigger compliance issues in jurisdictions with mandatory separation requirements. Organic waste left in warm areas accelerates decomposition and attracts pests.
The practical fixes are structural: place bins at the point of generation (not across the kitchen), size them to the volume produced between empties, and assign bin-emptying to a specific role on the closing checklist rather than leaving it to whoever notices. Weigh food waste by category at least twice a week. The data tells you whether your waste problem is a procurement problem, a portioning problem, or a storage problem, and each has a different fix.
How inconsistent cleaning schedules create health and operational risks
A cleaning schedule that exists on paper but is not enforced creates two compounding problems. The first is compliance: a food safety audit that finds a cleaning log with gaps is a direct path to a notice or a temporary closure. The second is operational: surfaces and equipment that are not cleaned on schedule degrade faster, harbor bacteria that contaminate product, and create the grease buildup conditions described earlier.
The most common failure mode is not that staff refuse to clean. It is that cleaning tasks are assigned at the end of a long shift to tired staff with no verification step. The fix is a signed checklist with a supervisor sign-off, not a longer list of tasks. Frequency matters too: a deep clean once a week does not compensate for daily surface cleaning that is skipped. For compliance-specific guidance on cleaning protocols in club and commercial kitchen environments, club kitchen compliance best practices provides a useful reference framework.
Why auditing your kitchen is worth more than you think
Running these audits feels like adding work to an already full plate. The honest reality is that most kitchens carry at least three or four of the ten inefficiencies above simultaneously, and most managers already sense where the problems are. The audit does not reveal surprises. It converts a vague sense of "things could run better" into a prioritized list with a cost attached to each item.
The compounding effect is real. Together, they add up to a measurable improvement in food cost percentage and labor efficiency within a quarter. Start with the highest-frequency, highest-cost problem on your list. Fix that one first, measure the result, and build from there.
Inventory and ordering inefficiency? Pantryhub addresses it directly
If inventory and ordering are your biggest operational drains, a purpose-built platform removes the manual burden that makes those problems persist.

Pantryhub is a hospitality inventory and ordering platform built specifically for restaurants, cafés, bars, and commercial kitchens. It gives you real-time stock visibility, AI-powered low-stock alerts, and supplier ordering in one place, so you stop ordering by memory and start ordering by data.
Who it helps most:
- 📦 Ops managers running daily counts manually across multiple product categories
- 🔔 Multi-site venues that need consistent stock visibility across locations
- 🛒 Kitchens with frequent stockouts that need automated reorder triggers before service is affected
Whether you are running a single café or a group of venues, Pantryhub gives you the stock control and reporting tools to reduce waste, cut emergency orders, and keep your menu running. Start a free trial or explore the platform to see how it fits your operation.
Sources
- Kitchen Layout and Workflow Alignment with Menu Requirements - Harris x Aoki | Hospitality Consultancy
- Common kitchen appliance mishaps and how to fix them - Consumer Reports
- How to Spot and Fix Inefficient Kitchen Workflows (Before They Burn You Out) • Chef's Icon
- Restaurant Kitchen Workflow: 7 Costly Service Bottlenecks