

Stock shrinkage in a commercial kitchen is the gap between what your records say you have and what's physically on the shelf — and it doesn't include the trim from a fish fillet or the bones from a stock pot. That's expected prep waste. Shrinkage is the unexplained difference: the bottle that vanished, the portion that was never recorded, the delivery that was short by half a case. For Australian kitchen managers, this gap directly inflates your Cost of Goods Sold and quietly erodes the margin you worked hard to build. Australian retail shrinkage benchmarks are typically around 1.4%, while hospitality operations with high perishability often experience higher shrinkage rates. Every percentage point matters.
Start here, right now:
- Count your top 20 cost items today. Don't wait for month-end. A targeted count on your highest-value SKUs gives you a baseline within hours.
- Flag any variance greater than your expected yield allowance. If your book says 10 kg of beef tenderloin and your shelf shows 8.5 kg, that 1.5 kg gap needs an explanation.
- Preserve evidence before you investigate. Lock down delivery dockets, check POS records, and photograph any damaged or short stock before it's moved or discarded.
Table of Contents
- What is stock shrinkage in an Australian kitchen?
- How do you calculate shrinkage in your kitchen?
- What causes stock shrinkage in commercial kitchens?
- What shrinkage rates are acceptable for hospitality operations?
- How do you measure and monitor shrinkage on an ongoing basis?
- Practical ways to reduce stock shrinkage in your kitchen
- Your 30-60-90 day plan to audit and fix shrinkage
- How does shrinkage affect your financials and menu pricing?
- A worked example: before and after shrinkage controls
- Why measurement is the first and most important control
- Key Takeaways
- The trap most kitchen managers fall into
- Pantryhub gives you real-time control over kitchen shrinkage
- Useful sources and templates
What is stock shrinkage in an Australian kitchen?
Shrinkage and waste are not the same things, and mixing them up is one of the most common errors kitchen managers make. Waste is measurable and expected: a whole chicken yields roughly 65–70% usable meat, and that trim goes straight to the stockpot. You know it's coming, you build it into your recipe costing, and it doesn't signal a problem. Inventory shrinkage, by contrast, is the stock that disappears without a recorded reason.
In hospitality settings, shrinkage shows up in ways that are easy to miss individually but devastating in aggregate. A bartender who free-pours spirits instead of using a jigger might over-pour by 5–10 mL per drink. Multiply that across a Friday night service and you've lost the equivalent of a full bottle. A comp meal that goes out without being entered into the POS doesn't just cost you the food — it creates a phantom variance that looks like theft when you count at month-end. A delivery received in cases but entered as individual units creates an apparent surplus that masks a real shortage elsewhere.
Other common kitchen-specific examples include:
- Mislabeled deliveries where a 5 kg bag is entered as a 5-unit quantity
- Staff meals recorded as waste rather than as a separate consumption category
- Incorrect unit conversions between purchase units (cases, kg) and recipe units (portions, grams)
- Unposted supplier invoices that make stock look higher than it is
Pro Tip: Set up a product-level "expected loss" allowance for every item with a known yield. Enter your standard yield percentage against each SKU so your system flags only the variance above that threshold. This way, a whole salmon that yields 60% fillet isn't generating a false shrinkage alert — only the unexplained loss above your yield benchmark triggers investigation.
How do you calculate shrinkage in your kitchen?
The math is straightforward. Three formulas cover everything you need:
Unit shrinkage = Physical count − Book count (this will be a negative number when stock is missing)

Shrinkage value = Unit shrinkage × Standard cost per unit
Shrinkage rate (%) = (Shrinkage value ÷ Net sales) × 100
Here's a worked example using realistic Australian kitchen numbers. Say you run a busy café in Melbourne. Your book inventory shows 15 kg of premium ground coffee at $28.00/kg. Your physical count at week-end shows 11.5 kg.
- Unit shrinkage: 11.5 − 15 = −3.5 kg
- Shrinkage value: 3.5 × $28.00 = $98.00
- If your weekly coffee sales revenue is $2,800: Shrinkage rate = ($98 ÷ $2,800) × 100 = 3.5%
That 3.5% shrinkage rate on a single SKU is well above any reasonable benchmark. It tells you immediately that something is wrong — whether it's over-portioning, unrecorded staff coffees, or a delivery discrepancy.
Use this table as a template for your weekly count to track inventory and variance values without specific shrink percentage figures.
Run this for your top 20 items every week. The pattern across periods tells you far more than any single count.
What causes stock shrinkage in commercial kitchens?
Shrinkage rarely has one cause. In most kitchens, it's a combination of small losses across multiple categories that compound over time. Administrative errors are more common than most managers expect — and they're worth ruling out before you start reviewing CCTV footage.
The most common causes in Australian hospitality operations include:
- Portion control failures: A chef who plates 180 g of protein instead of the standard 160 g doesn't think much of it. Across 80 covers a night, that's 1.6 kg of unaccounted protein loss per service.
- Over-pouring in bars: Free-pouring spirits, generous wine pours, and inconsistent cocktail builds are among the highest-impact causes of shrinkage in licensed venues.
- Unrecorded comp meals and staff meals: Any food or drink that leaves the kitchen without a POS entry creates a variance that looks identical to theft on a stocktake report.
- Wrong unit conversions: Receiving 10 cases of 12 bottles and entering 10 units instead of 120 bottles creates an apparent surplus that hides real loss elsewhere.
- Unposted supplier invoices: If a delivery arrives on Friday afternoon and the invoice isn't posted until Monday, your book stock is artificially low for the weekend count.
- Miscounted deliveries: A supplier who sends 18 kg when the invoice says 20 kg costs you money you'll never recover if you don't check at the gate.
- Poor storeroom-to-prep transfer controls: Stock that moves between a dry store and a prep kitchen without a transfer record simply vanishes from the count.
Red flags that signal a problem
Watch for these patterns in your variance reports:
- A single item showing consistent negative variance across multiple count periods
- Variances that spike immediately after deliveries (suggests receiving errors or supplier short-shipments)
- Discrepancies concentrated on one shift, one station, or one staff member's access period
- Sudden increases in a bar item's variance after a new staff member starts
How to investigate in the right order
Confirm your records first. Check that all invoices are posted, all transfers are recorded, and all unit conversions are correct. Then check deliveries: pull the delivery dockets and match them to the invoice and PO. Next, review recipes and portioning: weigh a few plates during service and compare to your standard recipe card. Only after ruling out administrative and operational causes should you move to reviewing access logs and CCTV.
What shrinkage rates are acceptable for hospitality operations?
Zero shrinkage is not a realistic target. Some loss is built into any operation that handles perishable goods, pours liquids, and processes raw ingredients. The goal is to understand your baseline, compare it to relevant benchmarks, and drive it down toward an acceptable range for your venue type.
Australian retail operations typically report an overall shrinkage rate of 1.4% of sales as a reference, with hospitality benchmarks varying significantly depending on the venue type and product category. Food-focused kitchens, bar and licensed venues, and high-perishability operations each have distinct shrinkage considerations, and managing them requires appropriate yield allowances.
Benchmarks are trend guides, not hard targets. If your shrinkage has been running at 4% and you bring it to 2.5% over three months, that's a meaningful win even if 2.5% is above the industry average. The direction matters as much as the number. Compare your rate to similar venue types, adjust for seasonal peaks (Christmas trading, school holidays), and use the benchmark to set a realistic improvement target rather than a pass/fail threshold.
How do you measure and monitor shrinkage on an ongoing basis?
A single stocktake tells you what happened. A consistent measurement cadence tells you why it keeps happening. The difference between a kitchen that controls shrinkage and one that doesn't is almost always the regularity of counts, not the sophistication of the tools.
Recommended counting cadence:
- Daily cycle counts for your fastest-moving, highest-cost items: spirits, premium proteins, and anything with a high theft risk. These don't need to be full counts — spot-check 5–10 items per day.
- Weekly counts for key SKUs across all major categories. This is where your shrinkage rate calculation lives. Run it every week, same day, same time, same person where possible.
- Monthly full stocktakes covering every item in every storage area. This is your financial reconciliation count and feeds directly into your COGS calculation.
KPIs worth tracking every period
- Shrinkage value ($): the raw dollar loss per period, by item and by category
- Shrinkage rate (% of sales): the primary benchmark metric
- Variance by item: which SKUs are consistently showing negative variance
- Variance by zone or shift: are losses concentrated in one area or time period?
- Days Inventory Outstanding (DIO): how long stock sits before use — high DIO on perishables predicts spoilage-driven shrinkage
The count-to-correction process
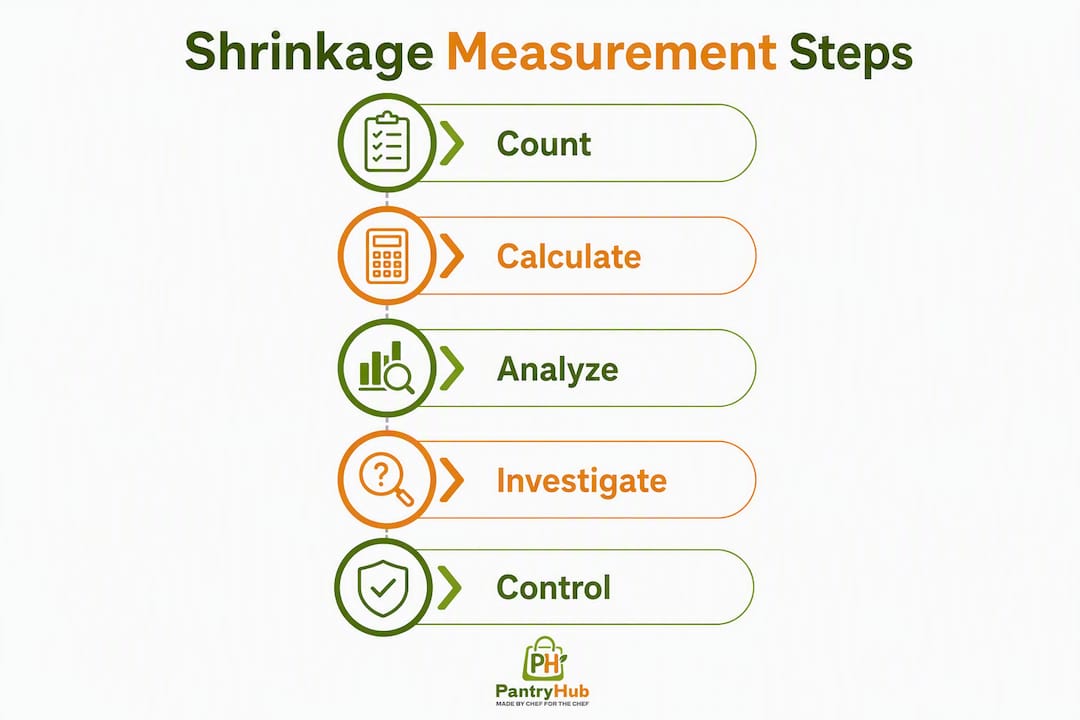
The process flow for every count period runs like this:
- Count physical stock against your book inventory
- Reconcile by checking all unposted invoices, transfers, and unit conversions
- Classify each variance: expected waste/yield loss, spoilage, or true unexplained shrinkage
- Investigate true shrinkage variances using the cause hierarchy above
- Correct records and adjust COGS for the period
Consistent, independent counts are what make variance investigation practical. When counts are irregular or done by the same person who manages ordering, the data loses its reliability as a control tool.
Practical ways to reduce stock shrinkage in your kitchen
Prevention works across three layers: operational controls, people controls, and technology controls. The highest-impact changes are usually the simplest ones — portion standardization and regular counts deliver more than any security camera.
Operational controls
FIFO and FEFO discipline (First In, First Out / First Expired, First Out) cuts spoilage-driven shrinkage by ensuring older stock is always used before newer stock. Label everything with a received date and a use-by date, and train your team to rotate automatically.
Standard recipe cards with gram-level portioning remove the guesswork from plating. When every chef knows that the chicken dish gets exactly 165 g of breast meat, portion variance drops to near zero. Weigh portions during service checks until the habit is locked in.
Smart storage and temperature controls protect against spoilage. A fridge running 2°C above spec can shorten the shelf life of proteins by 30–40%, turning a spoilage problem into what looks like a shrinkage problem on your count.
People controls
Access controls matter more than most managers realize. Limit storeroom access to the people who actually need it, and log who enters and when. A clear, written comping policy — with a mandatory POS entry for every comp, staff meal, and tasting — removes the ambiguity that allows unrecorded consumption to accumulate.
Anonymous reporting mechanisms (a simple suggestion box or a dedicated email address) give staff a way to flag suspected theft without the social risk of a direct accusation. Many kitchens recover significant losses simply by making it easier for honest staff to report what they see.
Technology controls
POS integration with your inventory system means every sale automatically reduces your book stock. When a barista sells a flat white, the 18 g of coffee is deducted from your inventory in real time. Variances that remain after POS reconciliation are genuine shrinkage, not sales you forgot to record.

Digital stocktake tools replace paper count sheets with a mobile app that timestamps every entry, flags unusual variances immediately, and feeds data directly into your reporting. The right digital tools cut count time significantly and make it practical to run weekly counts on a busy kitchen schedule.
Supplier invoice reconciliation, automated low-stock alerts, and variance reports by item and by period complete the technology layer. When your system alerts you the moment a SKU drops below par, you catch delivery shortfalls and consumption spikes before they compound.
Pro Tip: Before rolling out new controls across your whole operation, run a two-week pilot on your top five cost items. Measure shrinkage before and after. The numbers from that pilot are the business case you need to get your whole team on board.
Your 30-60-90 day plan to audit and fix shrinkage
Moving from awareness to sustained improvement takes a structured plan. Here's a realistic timeline for a busy Australian kitchen.
Days 1–30: Establish your baseline
- Run a full count on your top 20 cost items and calculate your current shrinkage rate using the formula above.
- Reconcile your POS sales data against your delivery records for the past four weeks — identify any unposted invoices or unit conversion errors.
- Implement immediate stop-gap controls for your highest-loss items: lock the spirits cabinet, introduce a mandatory weigh-in for premium proteins, and enforce POS entry for all comps.
- Assign count ownership: one person per zone, consistent schedule, documented results.
Days 31–60: Build the system
- Introduce portioning aids (scales, portion cups, jiggers) for every item with a standard recipe card.
- Set up a digital count schedule: daily spot-checks on fast-movers, weekly counts on key SKUs.
- Train your team on the comping policy, the FIFO rotation, and the new portioning standards.
- Set your KPI targets for shrinkage rate by category based on your baseline data.
Days 61–90: Lock in and review
- Integrate supplier invoice posting into your receiving process — no delivery accepted without a matched PO and invoice.
- Review your menu pricing for any items where COGS has shifted materially due to shrinkage corrections.
- Schedule your first recurring monthly full stocktake and assign ownership.
- Review your 30-day and 60-day shrinkage data, identify the two or three items still showing high variance, and investigate root causes.
Use the kitchen inventory checklist from Pantryhub to structure your baseline counts and track progress across each phase.
How does shrinkage affect your financials and menu pricing?
Shrinkage isn't just an operational problem. It's an accounting one, and understanding how it flows through your financials changes how you respond to it.
Under the matching principle, shrinkage is recorded as an expense in the period it occurs, not when it's discovered. It sits inside your Cost of Goods Sold, which means it directly reduces your gross margin. When shrinkage is undetected and unrecorded, your COGS is understated and your gross margin looks better than it actually is — until a stocktake reveals the gap.
A basic journal entry for a shrinkage write-off looks like this:
Debit: Cost of Goods Sold (Inventory Shrinkage) — $350.00 Credit: Inventory — $350.00
This entry moves the loss out of your asset account and into your expense account, where it belongs. It reduces your gross profit by exactly the shrinkage value for the period.
The downstream effect on menu pricing is direct. If your beef tenderloin dish is costed at a 28% food cost ratio and your actual shrinkage on tenderloin is running at 3.5% of sales, your real food cost on that dish is closer to 31.5%. A menu price set on the 28% assumption is underpriced. Over a month of service, that gap compounds into a material margin shortfall.
Reconcile your shrinkage adjustments monthly and feed the corrected COGS figures back into your recipe costing. Any item where shrinkage has been running consistently above your yield allowance needs either a price review or a root-cause fix — ideally both. This is also the data you need when negotiating with suppliers: if a specific SKU is showing repeated delivery shortfalls, your shrinkage records are your evidence.
A worked example: before and after shrinkage controls
Here's how the numbers look for a single high-cost SKU before and after a simple portioning and cycle-count intervention.
Scenario: A Sydney bistro is running weekly counts on beef tenderloin. Before controls, the head chef portions by eye. After controls, a digital scale is introduced at the pass and a weekly cycle count is scheduled every Monday morning.
| Metric | Before Controls | After Controls |
|---|---|---|
| Annual margin improvement | — | +$6,218.40 |
The intervention cost: one kitchen scale ($120) and 15 minutes per week for the count. The return: over $6,200 in recovered margin annually on a single SKU. Replicate that across your top 10 cost items and the financial case for structured shrinkage control becomes obvious.
Use the table structure above as a reusable template. Populate it weekly for your top SKUs, track the trend, and use the annual margin improvement column to prioritize where to focus your controls next.
Why measurement is the first and most important control
The hospitality industry has a well-documented problem with cumulative, invisible shrinkage. Individual losses are small enough to dismiss in the moment — a short pour here, a missed comp there — but they accumulate across every service, every week, every month. Without independent counts, there's no way to separate the signal from the noise.
This is why practitioners consistently identify baseline measurement as the first control, not the last. You cannot investigate what you haven't measured. You cannot fix a portioning problem you haven't quantified. And you cannot have a productive conversation with a supplier about delivery shortfalls without documented count data to back you up.
Finance teams treat shrinkage as a direct COGS expense, which forces it onto the profit and loss statement where it's visible to owners and accountants. That visibility is the mechanism that creates management accountability. When shrinkage is buried in a vague "wastage" line or simply not recorded, it never gets the attention it deserves.
There's also a critical distinction between apparent shrinkage and real shrinkage. Apparent shrinkage — the kind that disappears when you reconcile your delivery dockets or fix a unit-of-measure mismatch — is an administrative problem. It's fixable with better receiving processes and cleaner data entry. Real shrinkage, once you've ruled out the administrative causes, is where your investigation into theft, spoilage, and operational failures begins. Conflating the two wastes time and creates false alarms.
The practical conclusion: establish your baseline first, then move to root-cause controls. A reliable count cadence, even a simple weekly spot-check on your top 20 items, gives you the data foundation that makes every other control more effective.
Key Takeaways
Stock shrinkage in an Australian commercial kitchen is the unexplained gap between book inventory and physical stock, and controlling it starts with a consistent measurement cadence on your highest-cost items.
| Point | Details |
|---|---|
| Define shrinkage precisely | Shrinkage is unexplained stock loss — not expected prep waste or yield trim — and must be measured separately. |
| Use the three-formula method | Calculate unit shrinkage, shrinkage value, and shrinkage rate (% of sales) every count period for your top SKUs. |
| Benchmark and trend | Australian retail shrinkage runs near 1.4%; hospitality rates vary by venue type — use benchmarks as trend guides, not hard targets. |
| Prioritize measurement cadence | Daily spot-checks, weekly key-SKU counts, and monthly full stocktakes form the minimum reliable control framework. |
| Pantryhub automates the cycle | Pantryhub's real-time tracking, AI low-stock alerts, and variance reports replace manual spreadsheets and shorten the count-to-correction cycle. |
The trap most kitchen managers fall into
The most common mistake isn't failing to count. It's counting everything together — prep waste, spoilage, and true shrinkage lumped into a single "variance" line — and then drawing the wrong conclusions. A kitchen that's trimming a lot of fish because the supplier is sending lower-quality product will show a large variance. If that variance isn't separated from unexplained loss, the manager might tighten security when the real fix is a supplier conversation.
The practical consequence is that real theft or over-pouring stays hidden behind a wall of legitimate waste. You spend energy on the wrong problem and the actual loss keeps compounding.
The fix is simpler than most people expect. Assign count ownership to someone other than the person who does the ordering. Use photographed evidence for any disputed variance — a photo of a short delivery, a weighed portion that doesn't match the recipe card. And before you scale any new control across your whole kitchen, run a two-week pilot on your top five items. The data from that pilot will tell you whether the control is working and give you the credibility to get your team behind it.
Shrinkage control isn't about distrust. It's about building a kitchen where the numbers are reliable enough to make good decisions.
Pantryhub gives you real-time control over kitchen shrinkage
Knowing your shrinkage rate is one thing. Having a system that catches it before it compounds is another. Pantryhub is built specifically for Australian restaurants, cafés, bars, and commercial kitchens — and it replaces the spreadsheets, manual count sheets, and end-of-month surprises with live visibility across your entire inventory.
With Pantryhub, your hospitality inventory software works the way your kitchen does: real-time stock tracking that updates with every sale, AI-powered low-stock alerts before you run out, supplier invoice reconciliation that flags delivery discrepancies at the gate, and recipe standardization that locks in your portion costs. Variance reports by item, by zone, and by period give you the data to investigate shrinkage fast — not at month-end when the evidence is gone.
Whether you run a single venue or a multi-location group, Pantryhub gives you the count-to-correction cycle in one platform. Start your free trial at pantryhub.com.au and see your shrinkage data in real time from day one.
Useful sources and templates
The following resources informed this guide and are worth bookmarking for your own shrinkage management work:
- Inventory Shrinkage: Definition, Causes, and Impact — Corporate Finance Institute: accounting treatment, COGS recording, and the matching principle as applied to shrinkage.
- Inventory Shrinkage Definition — AccountingTools: administrative causes, unit-of-measure errors, and receiving process guidance.
- How Outsourced Stocktaking Helps Hospitality Businesses Control Stock Loss — Associated Stocktaking Services: hospitality-specific causes, independent count methodology, and baseline measurement.
- What Is Shrinkage in Inventory? — NetSuite: broad industry overview including restaurant-specific examples and journal entry guidance.
- Understanding Shrinkage: Causes, Impact, and Solutions — Investopedia: retail and hospitality shrinkage definitions, profit impact, and prevention strategies.
- Shrinkage Rate Benchmarks for Australian Retailers — POS Solutions: Australian retail shrinkage benchmarks and damaged-goods rate guidance.
Pantryhub templates and guides
Use these free resources from Pantryhub to put the controls in this article into practice:
- Kitchen Inventory Checklist: a ready-to-use template for baseline counts and ongoing cycle checks — download it, assign zones, and start counting today.
- Kitchen Stocktake Process Guide: step-by-step process for running a full stocktake in a busy kitchen, including how to classify variances and reconcile records.
- Inventory Alerts Guide for Australian Kitchens: how to set up low-stock and critical alerts so variances surface in real time rather than at month-end.
This article provides general operational and financial information for hospitality managers. For advice specific to your business's accounting treatment or legal obligations, consult a qualified accountant or financial advisor.