

A par level is the on-hand quantity you need to cover demand until your next delivery, plus a buffer for the unexpected. The core formula is PAR = (Average usage per period + Safety stock) ÷ Deliveries per period, or its lead-time cousin, PAR = (Average usage × Lead time) + Safety stock.
TL;DR:
- Delivery frequency and lead time accuracy significantly impact par level calculations, especially for inconsistent suppliers or rotating routes.
- Using actual delivery receipt dates and POS data improves par level precision, avoiding errors caused by relying on supplier quotes or memory.
- For perishables, adjusting for spoilage rates and packing sizes is essential to prevent waste and over-ordering.
- Statistical safety stock methods are recommended for high-cost or volatile items, but a flat percentage can suffice for low-value, high-turnover products.
- Real-time inventory management software like PantryHub automates par level tracking, reducing manual errors and optimizing cash flow.
Table of Contents
- How Do You Calculate Par Stock With the Core Formulas?
- How Do You Calculate Par Levels Step by Step?
- What's the Right Safety Stock Percentage for Your Menu?
- How Do Perishables Change Your Par Level?
- What Common Mistakes Undermine Par Level Accuracy?
- Why Par Levels Are Really a Cash-Flow Decision
- How PantryHub Turns Par Math Into a Live System
- Sources
- FAQ
How Do You Calculate Par Stock With the Core Formulas?
Two formulas cover almost every situation you'll run into behind the bar or in the walk-in, and picking the right one comes down to how your deliveries actually arrive.
The first is the deliveries-per-period formula: PAR = (Average usage per period + Safety stock) ÷ Deliveries per period. This works best when your supplier runs a fixed schedule, say, three deliveries a week, every week, like clockwork. You're dividing total need across a known number of restock points.
The second is the usage times lead-time formula: PAR = (Average usage × Lead time) + Safety stock, drawn from the Brightpearl inventory model. This one shines when delivery timing is inconsistent, distributors with rotating routes, or specialty suppliers who ship "within 2 to 5 business days." Instead of counting deliveries, you're measuring how long you'll actually wait for stock to arrive.
Here's how the two play out with real numbers:
- Bar bottles (fixed schedule): You use 84 bottles of house vodka per week, get deliveries twice a week, and carry a 25% safety buffer. PAR = (84 + 21) ÷ 2 = 52.5, rounded to 53 bottles per delivery cycle.
- Frozen bags (variable lead time): You use 12 bags of frozen fries per day, and your supplier's lead time runs 3 days on average. PAR = (12 × 3) + (12 × 3 × 0.25) = 36 + 9 = 45 bags.
Notice the units have to match. If your average usage is measured daily, your lead time must be in the same unit (days), otherwise your par level calculation will be inaccurate. The Unleashed Software guide makes the same point: par level and reorder point are not interchangeable, and neither formula works if your time periods don't line up cleanly.
How Do You Calculate Par Levels Step by Step?
Setting accurate par levels isn't guesswork if you follow a repeatable process. Here's the sequence that actually holds up in a working kitchen or bar.
- Pull usage data from your POS for 30 to 90 days. Longer windows smooth out one-off spikes (a big function, a slow week from bad weather) and give you a more honest average daily or weekly usage figure. OneCart's guidance recommends pulling at least 30 days of average daily sales and calculating the standard deviation with a function like STDEV.S if you're planning to use a statistical safety-stock method.
- Determine your delivery cadence or measure actual lead time. Don't take your supplier's quoted lead time at face value. Look at your last 10 to 15 delivery receipts and calculate the real average gap between order date and arrival date. Suppliers routinely quote optimistic numbers.
- Choose your safety-stock method and calculate the buffer. Flat percentage for low-stakes items, statistical calculation for anything expensive or unpredictable. More on both below.
- Calculate par, then convert it into an order. The formula gives you the target. The order quantity is what you actually need to buy: Order = max(0, Par − On-hand − Incoming + Commitments). On-hand is what's currently in the walk-in. Incoming is stock already ordered but not yet delivered. Commitments are units already promised to a catering job or private event.
Here's a worked example pulling all four steps together. A café tracks 60 days of POS data and finds it sells an average of 40 bags of drip coffee per week. Deliveries happen weekly.
PAR = (40 + 10) ÷ 1 = 50 bags per week.
Par Level Snapshot: Weekly average usage of 40 bags, plus a 25% safety buffer of 10 bags, sets a target par of 50 bags per delivery cycle, using the Zoho Inventory Academy formula.
If the café currently has 18 bags on hand and 0 incoming, the order quantity is 50 − 18 − 0 + 0 = 32 bags. That's the number that goes on the purchase order, not the par figure itself. Confusing the two is a common and costly mix-up.
What's the Right Safety Stock Percentage for Your Menu?
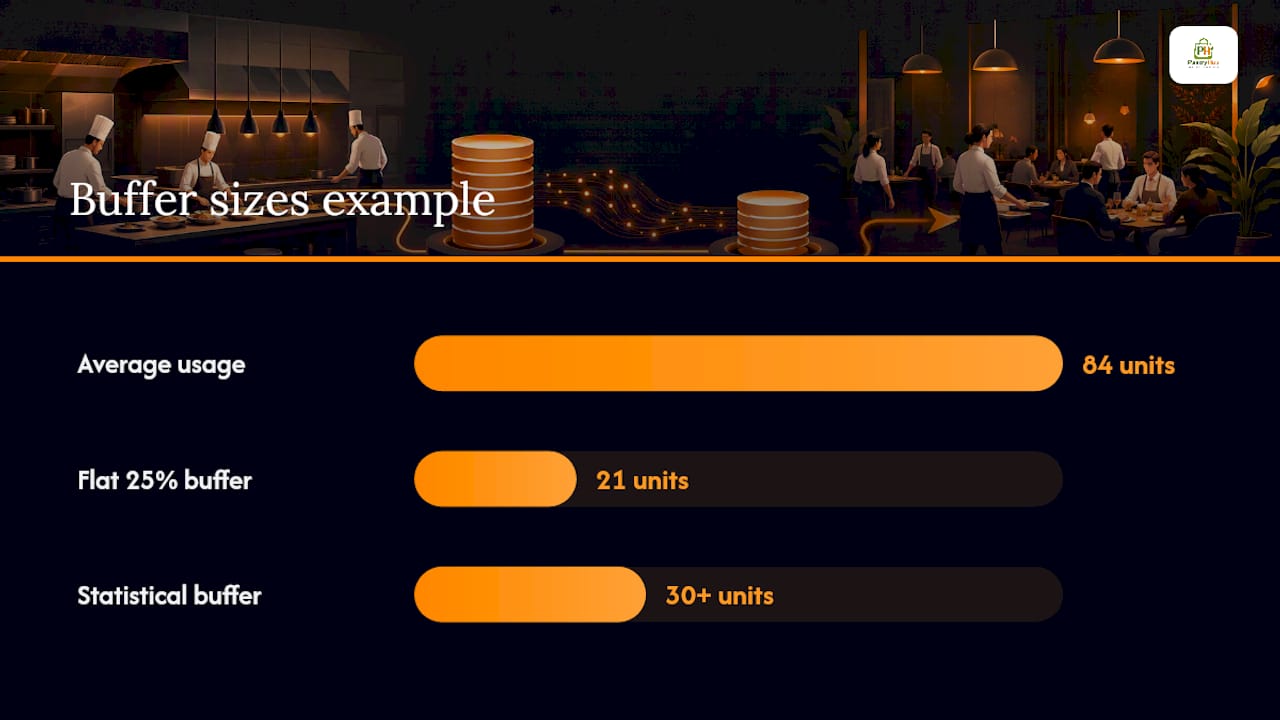
A dive bar going through 200 lime wedges a week doesn't need a regression model to figure out how many extra limes to keep on hand.
For items where a stockout is expensive (your signature dish's protein) or an overstock is costly (a $40-a-pound specialty cheese), the statistical method earns its complexity. The formula is Safety stock = z × σ × √T, where:
- z is your service-level factor (1.65 for roughly 95% service level, 2.33 for roughly 99%)
- σ is the standard deviation of your demand over your chosen period
- T is your protection period, typically your lead time in the same units as σ
This model, detailed in LineNow's replenishment calculator, factors in real demand volatility instead of a flat guess.
| Method | Input needed | Best for | Example output |
|---|---|---|---|
| Flat 25% buffer | Average usage only | High-turnover, low-cost items | 84 units usage → 21 units buffer |
| Statistical (z × σ × √T) | Usage, standard deviation, lead time | High-value or volatile-demand items | σ, z = 1.65, T = 3 days → buffer calculated using statistical method |
If your standard deviation is high, a flat percentage might set your buffer at 21 units when the statistical method calls for 30 or more, leaving you exposed during genuine demand spikes. Run the numbers for your top five highest-cost SKUs before deciding a flat percentage is good enough everywhere.
How Do Perishables Change Your Par Level?
Fresh ingredients decay, and a par formula that ignores that fact quietly manufactures waste. If you're calculating par for herbs, dairy, or seafood the same way you calculate it for canned tomatoes, you'll consistently over-order and toss the difference. The AIA hospitality inventory guide flags this as one of the most common and preventable sources of food cost blowouts.
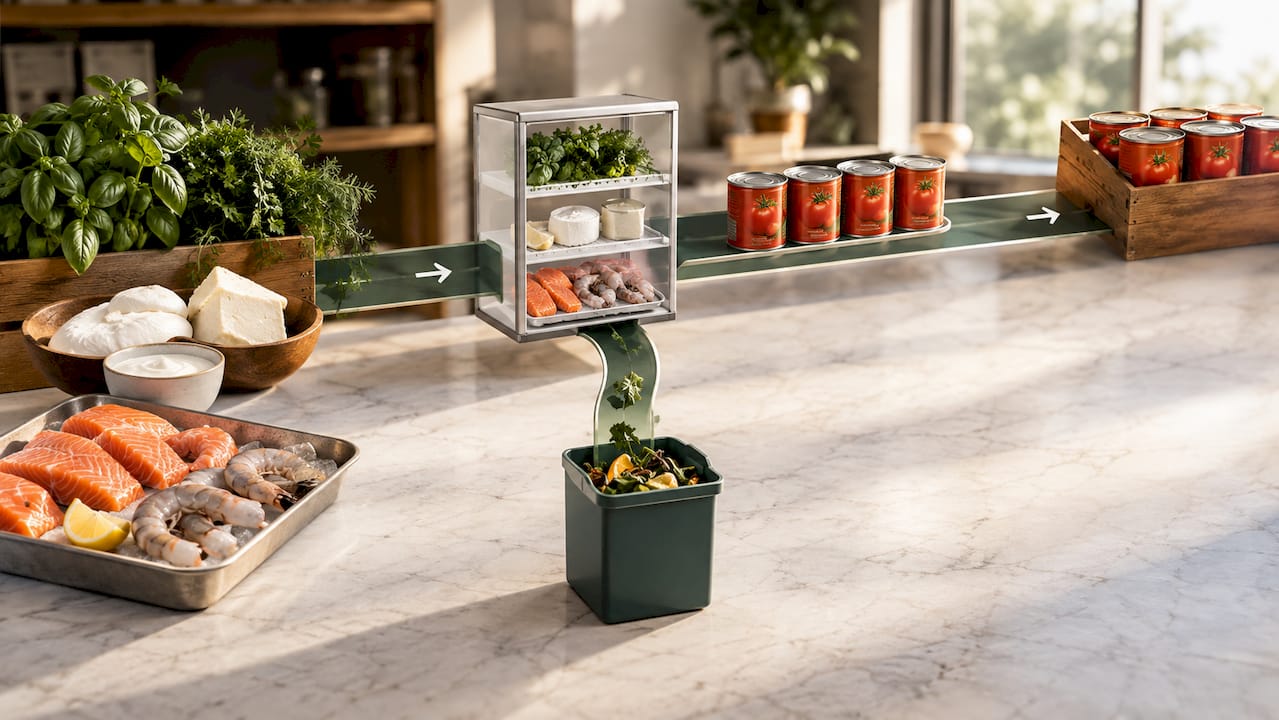
Build a decay factor into the calculation for anything with a shelf life under a week. In practice, this means reducing your effective base demand by your expected spoilage rate, so you're ordering to the amount you'll actually use, not the amount you'll receive.
A few adjustments make perishable par levels behave:
- Round to pack size, not to the ideal number. If basil comes in 500g bags and your par math says you need 620g, you're either buying two bags (overshoot) or one (undershoot). Build pack size into your par target from the start rather than discovering the mismatch at order time.
- Respect minimum order quantities. A supplier's MOQ can force you above your calculated par. When that happens, shorten your review interval instead of carrying the excess for a full week.
- Shorten the review cycle for fast-decaying items. Weekly par reviews work for dry goods. Fresh fish or herbs need par recalculated every two to three days.
- Use FIFO and expiry tracking religiously. Par level math assumes older stock moves first. If it doesn't, your "par" stops reflecting reality.
- Consider cross-venue pooling for multi-location operators. Shifting near-expiry stock between sites before it turns can absorb a forecasting miss without waste.
Pro Tip: Track your actual spoilage rate for a month before setting perishable par levels. Most kitchens overestimate how much fresh product they use and underestimate how much they throw out.
What Common Mistakes Undermine Par Level Accuracy?
Par level calculations fail for predictable reasons, and almost all of them trace back to bad inputs rather than bad math.
Use historical delivery receipt dates to calculate lead time, never the lead time your supplier quotes you. A distributor who promises "next-day delivery" but consistently arrives on day three will wreck your par accuracy every time, and your own delivery records are the only honest source for that number. Pull usage numbers from your POS system, not from memory or a manager's gut sense of "how much we go through."
Three mistakes show up constantly during rollout:
- Mixing time units. Weekly usage divided by a daily lead time produces a par level that's wrong by a wide margin. Check that every input in your formula uses the same time period before you calculate anything.
- Ignoring wastage and spoilage. A par level built purely on sales data, with no decay factor for perishables, systematically overstates what you should be ordering.
- Confusing reorder point with par level. Reorder point is the trigger, the inventory level that tells you it's time to order. Par level is the target, how much you want on hand after that order arrives. Treating them as the same number leads to chronic over-ordering.
A simple rollout checklist keeps the whole process manageable:
- Pick 5 to 10 pilot SKUs, a mix of dry goods, perishables, and one high-cost item.
- Calculate par levels for each using the appropriate formula.
- Run the new par levels for 2 to 4 weeks without major changes.
- Compare realized stockouts and waste against your prior month's numbers.
- Refine your safety-stock percentages based on what actually happened, then expand to more SKUs.
Efficient ordering workflows matter here too. The Wild Foodz efficiency guide makes the case that ordering cadence and inventory review timing are as much a workflow problem as a math problem, and tightening the process around your par numbers often matters more than the formula's precision.
Why Par Levels Are Really a Cash-Flow Decision
Par level calculation looks like a math problem, but it's really a decision about how much cash you're willing to tie up in the walk-in versus how much risk you're willing to carry of running out mid-service. Every unit of safety stock is money sitting on a shelf instead of in your bank account, and every stockout is a menu item you can't sell tonight.
Trying to apply statistical rigor to every SKU on day one is how par level projects stall out. Start with the five items where a miscalculation actually hurts your margin, get those right, measure the results for a few weeks, and expand from there.
— Admin
How PantryHub Turns Par Math Into a Live System
Running these formulas in a spreadsheet works until you're managing par levels across multiple sites, dozens of perishable SKUs, and a team that doesn't always update the sheet before service. That's the point where the math is right but the execution slips.

The platform is built specifically for hospitality venues, with pricing and support designed to match how kitchens order and receive stock. It tracks stock levels in real time, fires low-stock alerts before you hit a stockout, and connects directly to your suppliers so reordering doesn't depend on someone remembering to check a par sheet. If you're running multiple locations, dealing with high wastage on perishables, or just losing hours a week to manual counts, that's the signal to move off spreadsheets. The PantryHub food cost calculator converts your par quantities into dollar exposure so you can see the cash impact of every buffer decision. Check the Starter, Regular, and Pro plans or start a free trial to see your own par levels tracked automatically from day one.
Sources
- PAR Levels: Formula, Calculator & Templates — Zoho Inventory Academy
- Par level in inventory management — Brightpearl
- Free PAR Level Calculator: Replenishment Math — LineNow
- PAR Levels in Inventory Management (with Formula & Examples) — Unleashed Software
FAQ
How Do You Calculate a Par Level?
Use PAR = (Average usage per period + Safety stock) ÷ Deliveries per period when your supplier runs a fixed schedule, per the Zoho Inventory Academy formula.
How Do I Calculate PAR Stock Levels for a Restaurant?
Pull 30 to 90 days of usage data from your POS system, determine your delivery cadence or average lead time from actual receipt dates, then apply either core formula. For perishables, reduce the base demand figure by your expected spoilage rate before calculating the final par.
How Do You Calculate the Minimum and Maximum Inventory Levels?
Minimum inventory generally aligns with your reorder point, the level that triggers a new order, while maximum inventory aligns with your par level, the target quantity after restocking. They're related but distinct: reorder point tells you when to order, and par tells you how much you're ordering up to, a distinction the Unleashed Software guide covers in detail.
Can Software Automate Par Level Calculations?
Yes. Platforms like PantryHub track real-time usage and stock levels automatically, then generate low-stock alerts based on your calculated par, removing the need to manually recalculate every week. Pricing for PantryHub's plans is listed on its website, and a free trial is available for venues wanting to test the automation first.