
Food cost variance is the dollar gap between what your recipes say you should have spent on food and what your inventory and invoices show you actually spent. It shows up as a percentage, but it lives in dollars, and those dollars are recoverable margin sitting on your P&L right now. A variance under 2 percentage points is well-managed. 2 to 3 points is acceptable, and anything past 5 points signals a systemic problem that needs attention this week, not next quarter.
TL;DR:
- Variance over 5 percentage points indicates a systemic problem that requires immediate investigation and correction.
- High-volume menu items should have recipes updated frequently to reflect current supplier prices, ideally matching price fluctuations.
- Regularly comparing inventory, invoices, and POS data minimizes timing errors and accounts for unlogged waste and staff discounts.
- Daily spot checks of high-cost ingredients and weekly cycle counts help detect and prevent unseen waste, spoilage, or theft.
- Using software like PantryHub automates recipe cost updates, streamlines invoice matching, and consolidates data for faster variance analysis.
Table of Contents
- What Is Food Cost Variance Analysis?
- How Do You Calculate Actual Vs Theoretical Food Cost?
- What Causes Food Cost Variance in a Restaurant?
- In What Order Should You Investigate Variance?
- Which Daily and Weekly Controls Actually Reduce Variance?
- How Do You Know if Your Variance Is Too High?
- What Should You Do When Variance Spikes Suddenly?
- How PantryHub Supports Food Cost Variance Routines
- Why Variance Deserves a Weekly Seat at the Table
- Put These Routines Into PantryHub This Week
- Sources
- FAQ
What Is Food Cost Variance Analysis?
Food cost variance analysis compares your theoretical food cost, what your recipes and sales mix predict you should spend, against your actual food cost, what your inventory and purchase records show you did spend. The difference between those two numbers, in both dollars and percent, is your variance. Industry practitioners call this actual versus theoretical, or AvT, and it's the standard diagnostic for finding where margin is leaking out of a kitchen.
The math breaks down into three formulas you'll use constantly:
- Theoretical food cost = sum of (recipe cost per item × units sold) across your menu, based on standardized recipes with edible portion (EP) yields already factored in.
- Actual food cost = opening inventory + purchases − closing inventory, measured over the same period.
- Variance = Actual food cost − Theoretical food cost, expressed in dollars, then divided by revenue to get variance percent.
A few data hygiene rules matter more than the formulas themselves. First, recipe coverage has to be high, ideally north of 95% of sold items mapped to a current, costed recipe, or your theoretical number is fiction. Second, use as-purchased (AP) cost converted to edible-portion (EP) cost consistently; a case of whole tomatoes doesn't yield a case of diced tomatoes, and if your recipe costing skips that trim loss, your theoretical cost will always run low. Third, pull actual and theoretical from the exact same date range. Comparing a Monday to Sunday POS report against a Tuesday to Tuesday inventory count will manufacture variance that isn't real.
How Do You Calculate Actual Vs Theoretical Food Cost?
Calculating variance is a five-step process, and the inputs come from three places you already have: your point-of-sale system, your supplier invoices, and your physical inventory counts.
- Pull your sales mix from POS for the period, item by item, with quantities sold.
- Multiply each item's recipe cost by units sold to get total theoretical cost.
- Take opening inventory value, add purchases from invoices during the period, and subtract closing inventory value to get actual cost.
- Subtract theoretical from actual to get your dollar variance.
- Divide dollar variance by revenue to express it as a percentage point gap.
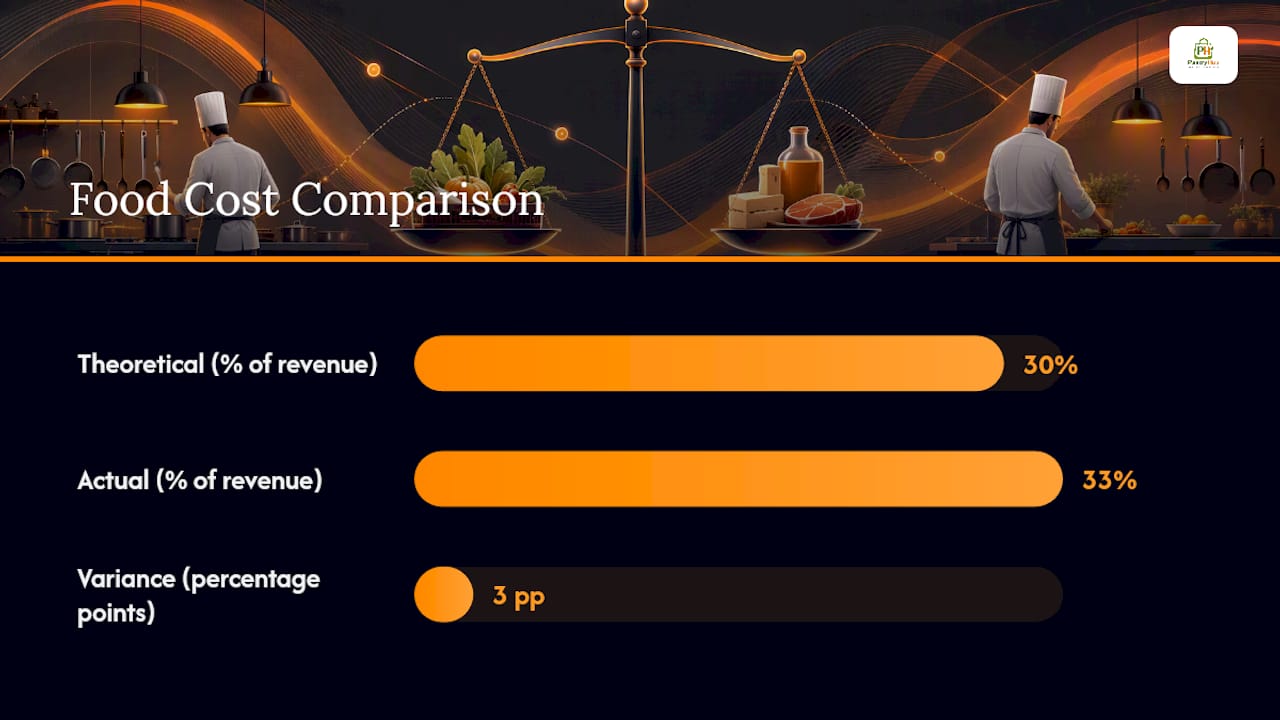
Here's a worked example. Say a 120-seat restaurant does $40,000 in food revenue for the week. Recipe costing against the POS sales mix says theoretical food cost should be $12,000, a 30% theoretical food cost. Opening inventory was $18,000, purchases for the week totaled $13,500, and closing inventory came in at $18,300. Actual cost = $18,000 + $13,500 − $18,300 = $13,200.
Variance = $13,200 − $12,000 = $1,200, or 3 percentage points of revenue (3% actual variance on a 30% theoretical target, landing at 33% actual food cost).
That $1,200 gap, repeated weekly, is over $62,000 a year walking out the back door somewhere between the walk-in and the plate.
Two mistakes wreck this calculation more than any other. Managers pull inventory counts on different days than the POS export, creating phantom variance from timing alone. And they forget to adjust for staff meals, comps, and promotional discounts, which distort actual cost without showing up in revenue-based theoretical projections. Nail the period alignment and the adjustments, and the math becomes trustworthy fast.
What Causes Food Cost Variance in a Restaurant?
Variance almost always traces back to one of five causes, and experienced operators learn to recognize the fingerprints of each.
- Stale recipe costs. Supplier prices move, but if nobody updates the recipe card, your theoretical cost is calculated against yesterday's prices. Practical guidance from cost-control practitioners is to update recipe costs as often as supplier prices actually fluctuate, not on a fixed quarterly schedule.
- Portioning drift. A line cook who scoops a slightly heavier portion of protein, night after night, doesn't look like theft. It looks like a rounding error, until you multiply it by 300 covers a week.
- Unlogged waste and spoilage. Trim waste, overproduction, and product that spoils before use all inflate actual cost without ever appearing in a waste log, so the loss gets misread as unexplained shrinkage.
- Receiving and invoice errors. Short-shipped cases that get signed for as complete, price increases that slip past a distracted receiver, and billing errors all push actual cost up silently.
- Theft and unrecorded comps. The least common cause but the most damaging when it happens, ranging from a bartender free-pouring for friends to inventory walking out the door in a backpack.
Stale recipe costs and portioning drift tend to be the most frequent culprits in most kitchens, simply because they're invisible day to day. Nobody notices a recipe card is six months out of date. Everybody notices a break-in. That's exactly why the diagnostic order matters: check the boring, likely causes before you assume the dramatic, unlikely one.
In What Order Should You Investigate Variance?
Run your diagnostic in the order likely causes actually occur, not the order that feels most urgent emotionally. Jumping straight to theft accusations when the real problem is a stale recipe card damages trust with your team and wastes time.
- Check recipe accuracy and POS mapping first. Confirm every high-volume menu item has a current, costed recipe and that POS modifiers (extra cheese, no rice) are mapped to the right ingredient adjustments.
- Audit receiving and invoices next. Pull the last two weeks of invoices for your top-cost categories and verify quantities received match quantities billed, and that unit prices match your recipe costs.
- Sample plating on the line. Watch three to five services on your highest-volume protein items and weigh portions against the recipe spec.
- Review waste logs against physical observation. If your waste log shows near-zero waste but your dumpster tells a different story, you've found unlogged waste.
- Escalate to theft checks only if the first four steps come up clean. This usually means unexplained inventory gaps localized to a specific shift, station, or employee.
Running actual-versus-theoretical at the category level, proteins, dairy, and liquor first, isolates the problem far faster than a blended, whole-kitchen number.
Pro Tip: Timebox each diagnostic step. Give yourself 24 hours for the recipe and receiving audit, 24 hours for plating observation, and 24 hours for waste log review. If you haven't found the source in 72 hours, you're looking in the wrong category, not the wrong restaurant.
Which Daily and Weekly Controls Actually Reduce Variance?
Diagnosis finds the leak. Routines keep it from reopening. The controls that work split cleanly across three cadences.
Daily, run spot portion checks on your two or three highest-cost menu items during peak service, cycle count high-value ingredients like tenderloin or top-shelf liquor, and spot-check receiving against packing slips before a driver leaves your loading dock.
Weekly, run full category-level cycle counts on proteins, dairy, and liquor, since weekly tracking isolates a problem to a specific shift or delivery instead of burying it in a month of data.
Monthly, complete a full physical inventory across every category, reconcile the entire AvT calculation kitchen-wide, and reconcile supplier credits against invoices to catch billing disputes before they age out of collectability.
Underneath the counting schedule, four process controls do the heaviest lifting:
- Put a scale at receiving and weigh spot-check deliveries against invoice weights, not just case counts.
- Laminate plating specs with photos at every station so portioning isn't a matter of memory.
- Enforce FIFO rotation with a marker and a Sharpie system so nobody's cooking from the newest case while an older one spoils in back.
- Log waste at the moment it happens, not at the end of shift from memory, using a simple clipboard or a digital tracking tool.
How Do You Know if Your Variance Is Too High?
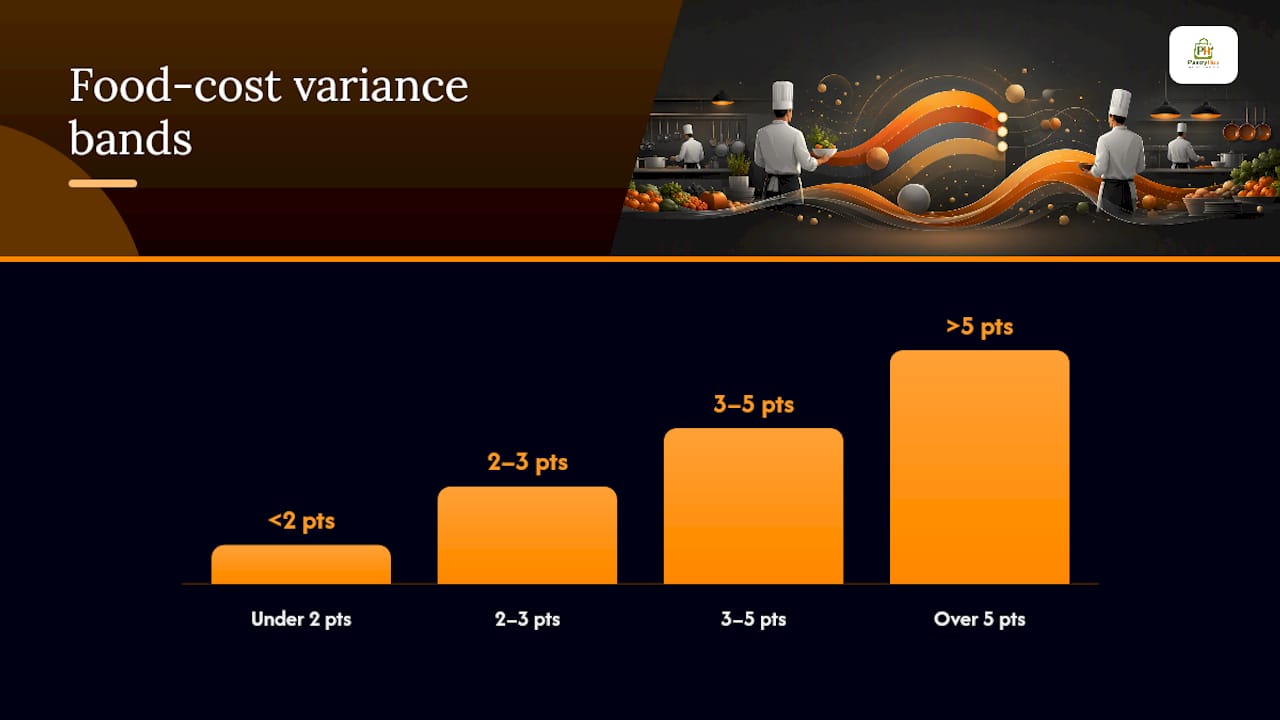
Acceptable variance bands depend heavily on concept complexity. A quick-service concept with six menu items and simple recipes should run tighter than a scratch-kitchen fine-dining operation juggling forty dishes and daily specials. As a general benchmark, under 2 percentage points is well-managed, 2 to 3 points is acceptable, 3 to 5 points is common but improvable, and anything over 5 points signals a systemic issue worth immediate investigation.
The percentage alone can mislead you, though, and understanding sustainability measures and waste reduction helps improve profitability by cutting food cost dollars. Converting variance points into dollars against your actual sales base tells you whether a fix is worth the labor hours it takes to chase, because reducing food cost dollars flows straight to your bottom line without the added variable costs that come with driving equivalent revenue growth.
Assign ownership. A chef or kitchen manager should own the diagnostic work, while a general manager or owner reviews the dollar trend weekly and asks pointed questions when a category moves.
What Should You Do When Variance Spikes Suddenly?
A sudden jump in variance calls for triage, not a slow month-long audit. Work through this in the first 72 hours:
- Freeze non-critical purchasing and verify the last two weeks of invoices against what was actually received.
- Recost your ten highest-cost menu items using current supplier pricing, since a spike often traces back to one or two ingredients whose price jumped without anyone updating the recipe.
- Run spot portion checks on those same ten items across at least two shifts.
- Audit receiving records line by line for the affected categories and run a same-day waste check against your dumpster and prep trim.
- Escalate to a theft review only if the pattern points to a specific shift, station, or employee after the first four steps come up clean.
A focused 90-day program typically moves operators from 6 to 8 percent variance down to 3 to 4 percent without touching a single menu price, which tells you most spikes are fixable with attention, not price increases.
How PantryHub Supports Food Cost Variance Routines
Every control above depends on data being current and easy to pull, which is exactly where most kitchens fall behind on spreadsheets. This software solution was developed to close that gap.
- Recipe costing updates automatically when supplier prices change, so your theoretical cost never runs on stale numbers.
- Supplier integration and ordering keeps invoices tied directly to your inventory counts for faster receiving audits.
- Low-stock alerts flag ingredients before a shortage forces a rushed, unplanned purchase at a worse price.
- Reporting tools break variance down by category, proteins, dairy, liquor, so you're not stuck chasing a blended number.
For a quick first look at your own numbers, PantryHub's free Food Cost Calculator converts your percent variance into recoverable dollars in a couple of minutes. Tools like this don't replace the diagnostic work above, they free up the hours you'd otherwise spend rebuilding spreadsheets, so you can spend that time actually enforcing plating specs and reviewing waste logs.
Why Variance Deserves a Weekly Seat at the Table
Most operators treat AvT as a monthly accounting exercise, something the bookkeeper hands over after the fact. That's backwards. Variance is a daily operational signal, not a historical report card, and the kitchens that close the gap fastest are the ones that put the weekly category number in front of shift leaders, not just owners. That gap doesn't close itself. It closes because someone checks it every week and asks why liquor moved half a point.
— Admin
Put These Routines Into PantryHub This Week
Every control in this guide, recipe costing, category cycle counts, receiving checks, waste logging, depends on having current numbers in one place instead of scattered across spreadsheets and a shoebox of invoices. The platform is designed with AUD pricing and local support tailored for Australian hospitality venues, not adapted from a US platform.

Start with the free Food Cost Calculator to see your own variance in dollars before you commit to anything. If the numbers convince you it's worth fixing properly, PantryHub's plans run from Starter at $39 AUD per month up to Pro at $99 AUD per month, scaled to how many locations and features you need. Every plan starts with a free trial at Pantryhub, so you can run a real week of recipe costing and receiving checks against your own kitchen before paying anything. If you're weighing options in a specific city, PantryHub also runs dedicated setups for operators in Sydney and Melbourne.
Sources
- Actual vs Theoretical Food Cost (Variance Explained) — RestaurantCalcs
- Understanding the true impact of food cost on profitability — NRN
- Actual vs Theoretical Food Cost (AvT) Guide | FORCS
FAQ
What Does a 33% Food Cost Percentage Mean?
It's not automatically a problem if your menu pricing and labor model are built around that number, but if your theoretical target is 30% and actual comes in at 33%, you have a 3 percentage point variance worth investigating.
What Is the 30/30/30/10 Rule in Restaurants?
It's a planning starting point, not a fixed law, since concept type and market rents shift those percentages considerably.
How Do You Calculate a 30% Food Cost?
You calculate food cost percentage by dividing your total food cost by total food revenue for the same period.
What Does Variance Mean in Food Cost?
Variance in food cost is the dollar or percentage gap between your theoretical cost, what recipes and sales mix predict you should have spent, and your actual cost, what inventory and purchase records show you spent. A variance under 2 percentage points is considered well-managed, while anything past 5 points signals a systemic issue in receiving, portioning, or recipe accuracy.