

ABC inventory analysis ranks your SKUs by annual usage value and sorts them into three tiers so you spend your time and cash on the items that actually move your business. The payoff is fewer stockouts on the products that matter and lower carrying costs on the ones that don't. If you manage stock right now, your next move is simple: pull your SKU list and run the numbers below.
TL;DR:
- Reclassify low-cost but critical items, like essential ingredients, into A-tier regardless of usage value to prevent costly stockouts.
- Regularly update classifications quarterly and assign owners for A items to maintain inventory accuracy and accountability.
- Focus on usage value calculations using annual units sold and unit cost, but incorporate criticality flags to adjust rankings where needed.
- Place A-tier items in accessible locations and count them weekly, while distributing C items to less-frequent storage and quarterly checks.
- Use automatic inventory management systems to continuously update classifications, trigger alerts, and streamline stock control across multiple sites.
Table of Contents
- What Is ABC Inventory Analysis and Why Does It Work?
- How Do You Calculate ABC Classification? A Worked Example
- Turning Classes Into Daily Operating Rules
- What Results Should You Actually Expect?
- Where ABC Analysis Goes Wrong
- Rolling Out ABC: A Step-by-Step Implementation Plan
- Using ABC to Guide Cycle Counts and Storage Layout
- Applying ABC in a Commercial Kitchen
- What Leaders Should Actually Prioritize
- Run Your ABC Playbook Without the Spreadsheet Maintenance
- Sources
What Is ABC Inventory Analysis and Why Does It Work?
ABC inventory classification sorts stock into three groups based on usage value, not shelf price. Usage value is unit cost multiplied by how many units you move in a year, which means a cheap item ordered constantly can outrank an expensive item that barely moves. That distinction trips up almost every operator running this for the first time.
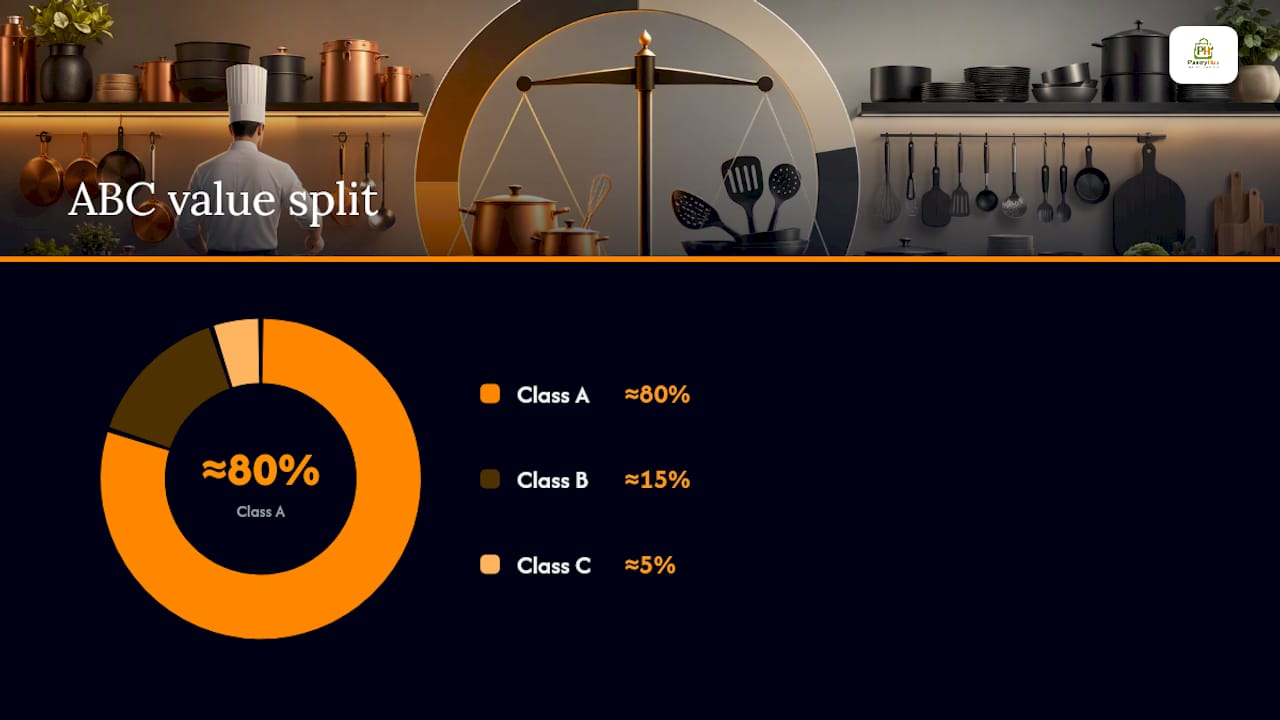
The logic borrows from the Pareto principle, the observation that a small share of inputs tends to drive most of the outcome. Treat that as a pattern to expect, not a rule to force. Some kitchens run leaner, some run flatter, and forcing an 80/20 split on data that doesn't support it just produces a classification you'll ignore in a month.
ABC works best when you have consistent unit costs, a full year (or season) of usage data, and SKUs that don't change every week. It works poorly for brand-new product lines or businesses with wild seasonal swings and no history to lean on.
- Usage value ranks by dollars moved, not sticker price
- The 80/20 split is a guideline, not a formula
- Low-cost, high-criticality items (like a $4 sauce base that stops six menu items without it) often need to be bumped into A-tier regardless of what the math says
How Do You Calculate ABC Classification? A Worked Example
The formula is straightforward: annual usage value = unit cost × annual units sold. Once you have that number for every SKU, the rest is sorting and drawing lines.
- Pull unit cost and annual units sold for every active SKU.
- Multiply the two to get annual usage value per line.
- Sort the list in descending order by usage value.
- Calculate the running cumulative percentage of total value.
- Draw cut lines, commonly A up to roughly 80% of cumulative value, B up to roughly 95%, and C for the remainder, then adjust by category as needed.
Here's a simplified 8-SKU version for a mid-sized kitchen:
In a spreadsheet, the InventoryQuick worked playbook uses this exact structure: cumulative percent as =SUM($D$2:D2)/SUM($D$2:$D$11), then class as =IF(F2<=0.8,"A",IF(F2<=0.95,"B","C")). Adjust those cut lines per category. A butcher shop and a dry goods pantry rarely share the same natural break point.
Turning Classes Into Daily Operating Rules
Classification without operating rules is just a spreadsheet nobody looks at again. Each tier needs its own count cadence, reorder logic, and owner.
- A items: count weekly, keep tighter safety stock, and assign a named owner who reviews levels and reports weekly.
- B items: count monthly, moderate safety stock, review at a standing team meeting.
- C items: count quarterly, bulk-order to minimize handling, and don't sweat minor variance.
- Negotiate harder on A-class lines. The CIPS ABC classification guide notes A items typically drive the majority of spend, which gives you real leverage on price and delivery terms with suppliers.
Pro Tip: Give your A-tier owner a standing weekly slot on the calendar, not just a task on a list. Classification decays fast when nobody's accountable for keeping it current.
What Results Should You Actually Expect?
Done right, ABC analysis improves inventory turnover and cuts carrying costs by putting cash where it earns its keep instead of tied up in slow-moving stock. Service levels on A items climb because you're watching them closely enough to catch a shortage before it becomes a stockout. Cycle counting gets faster too, since staff spend less time counting low-value C items that barely move the needle.
The metrics worth tracking: inventory turnover rate, service level (fill rate) on A items, stockout frequency, and days of inventory on hand. Watch these monthly for your A tier and you'll catch drift before it costs you a service failure.
Where ABC Analysis Goes Wrong
Most failures aren't conceptual. They're execution mistakes that quietly erode the whole system.
- Ranking by unit price instead of usage value, which misclassifies cheap, high-volume items as unimportant
- Setting a classification once and never rerunning it as demand shifts
- Ignoring criticality, so a low-cost part with a long lead time gets treated as low-priority until it causes a shutdown
- Letting seasonal spikes distort a full-year average without adjusting for it
- Feeding the model bad or incomplete usage data, which the Monash University inventory glossary flags as one of the most common practical failure points
Rolling Out ABC: A Step-by-Step Implementation Plan
A phased rollout beats a big-bang switch every time, mostly because it lets you catch bad assumptions before they spread across your whole catalog.
- Cleanse your data. Confirm every SKU has accurate unit cost, annual units sold, and lead time. Gaps here undermine everything downstream.
- Pilot with one category. Pick a single product category, run the calculation, and sanity-check the cut lines against what your team already knows about demand.
- Assign owners. Every A-tier line needs a named person accountable for its count and reorder decisions.
- Roll out and train. Extend the classification to the rest of your catalog, train staff on the new count cadence, and configure low-stock alerts by class.
- Sustain with a KPI dashboard. Track turnover, service level, and stockout rate, and reclassify quarterly as demand shifts.
Pro Tip: Run your pilot on a category with clean, stable data, like proteins or bar spirits, rather than a category with constant menu changes. A messy pilot teaches you nothing about whether the method works.
For a broader look at building this cadence into daily kitchen operations, the Wild Foodz efficiency guide covers workflow structures that pair well with a class-based count schedule.
Using ABC to Guide Cycle Counts and Storage Layout
Classification should change where things sit, not just how often you count them. A items belong closest to your dispatch or prep zone, because shorter travel distance for your highest-volume picks saves real labor over a year. C items can sit in remote or overflow storage since staff touch them rarely.
- Place A-class ingredients within arm's reach of prep stations and dispatch points
- Push slow-moving C items to back storage or top shelves
- Count A items weekly on a fixed schedule; let C items ride on quarterly, exception-driven audits
- Trigger an unscheduled count only when a variance or supplier delay flags a problem
The AccountingTools ABC method overview backs this pattern directly: A items get more frequent counts and prime pick locations, while C items stay low-touch until something forces a closer look. A well-slotted kitchen with accurate ingredient-level stock tracking can shave meaningful time off every prep shift, purely from shorter walk paths and fewer wasted counts.
Applying ABC in a Commercial Kitchen
Usage value alone misses one thing that matters enormously in hospitality: criticality. A $4 tin of saffron that shows up on six menu items behaves like an A-tier ingredient even if its dollar volume says otherwise. Running out halts orders, not just margin.
- Layer a criticality flag on top of usage value for any ingredient that stops multiple menu items if it runs out
- Elevate low-cost, high-criticality ingredients to A-tier handling even when the raw math puts them in B or C
- Use low-stock alerts on A-tier and flagged-critical items so nobody discovers a gap mid-service
- For multi-site groups, run classification per venue first, then compare across locations before standardizing pars
Pantryhub's multi-site inventory reporting and automated low-stock alerts map directly onto this playbook. Cycle counts, reorder triggers, and supplier ordering all sit on top of the same classification logic, without a spreadsheet you have to remember to update.
What Leaders Should Actually Prioritize
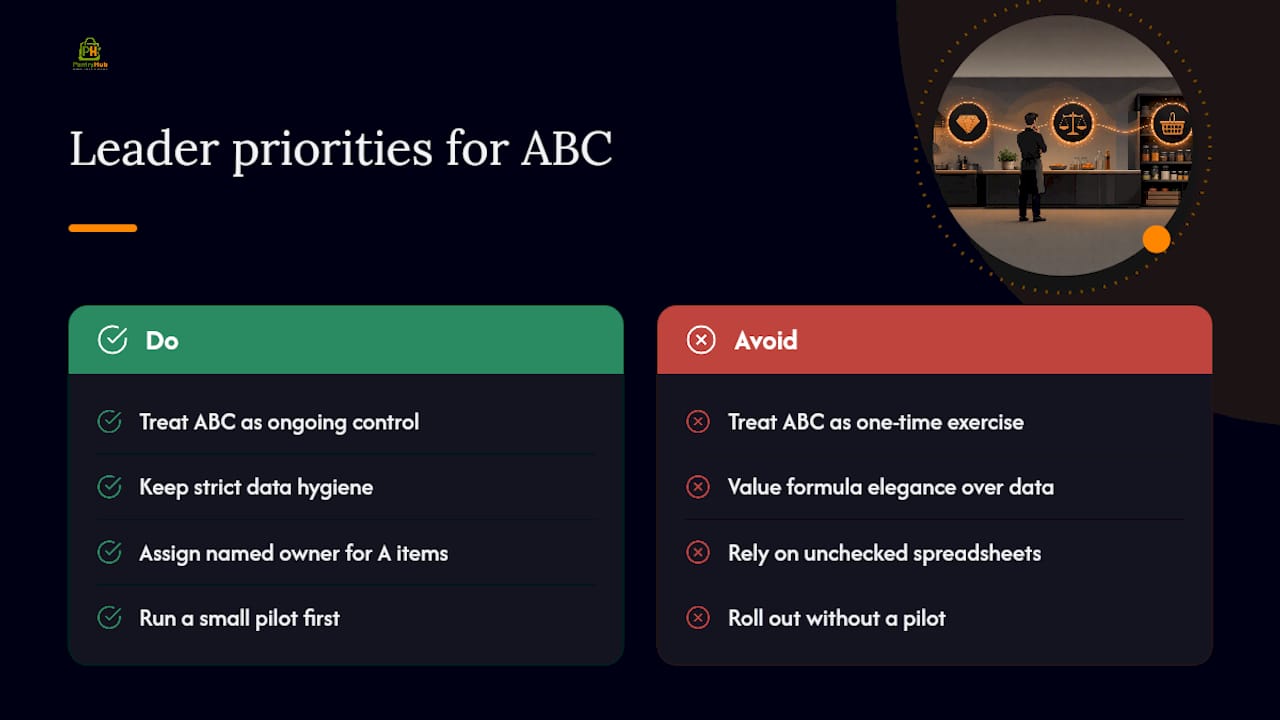
The mistake most operators make isn't picking the wrong cut lines. It's treating ABC as a one-time exercise instead of an operating control. Data hygiene matters more than the elegance of your formula, and a named owner for A-tier items matters more than a perfect spreadsheet nobody checks.
Run a small pilot first. Measure turnover and stockout rate before rolling out further. Then reclassify on a quarterly schedule, because the moment you stop, your classification starts drifting away from reality.
— Admin
Run Your ABC Playbook Without the Spreadsheet Maintenance
Pantryhub turns the ABC classification you just built into a live operating system instead of a document that goes stale by next quarter. Where a spreadsheet needs someone to manually rerun cut lines and chase count sheets, Pantryhub applies your class rules automatically: low-stock alerts fire on A-tier and criticality-flagged items, cycle-count schedules run on the cadence you set per class, and supplier ordering pulls straight from your real usage data across every venue.

If you run more than one site, Pantryhub's multi-location inventory reporting keeps classification consistent across venues instead of living in separate spreadsheets nobody reconciles. Start a free trial on the Pantryhub platform and load your own SKU list to see your A, B, and C tiers built out in minutes.
Sources
- ABC Analysis for Inventory: Thresholds, Worksheet & Playbook — InventoryQuick
- ABC classification & ABC method — CIPS
- ABC inventory analysis — Monash University