

Accurate demand forecasting cuts excess food purchases and aligns staff rosters to actual covers, turning ordering and scheduling into data-driven decisions instead of gut calls. Restaurants using a structured approach, including tools like PantryHub, typically track forecast accuracy with Mean Absolute Percentage Error (MAPE) and use that number to shrink waste, tighten labor hours, and protect margins week over week.
TL;DR:
- Using demand forecasting can significantly reduce spoilage of high-cost perishables like seafood and dairy by improving purchase accuracy.
- Accurate forecasts require clean, unified data, including item-level sales, channel tags, recipe yields, supplier pack sizes, and event flags, with at least 12 months of history.
- Starting with simple baseline models like rolling averages or seasonal naive forecasts allows rapid implementation before progressing to more complex statistical or machine learning methods.
- Regularly reviewing forecast accuracy through metrics like MAPE and bias helps detect errors and prevent over- or under-stocking, maintaining steady margins.
- Implementing a disciplined, weekly forecast review and layering in data like weather and holidays leads to measurable improvements in waste reduction and labor efficiency.
Table of Contents
- What Does Demand Forecasting Do for a Restaurant?
- What Data Does Restaurant Demand Forecasting Need?
- Which Forecasting Method Fits Your Restaurant?
- How Do You Roll Out Forecasting Step by Step?
- How Do You Measure Forecast Accuracy?
- What Mistakes Break Restaurant Forecasts?
- How PantryHub Turns Forecasts Into Daily Action
- What Do Real Forecasting Wins Look Like?
- A Publisher's Take: Forecasting Is a Habit, Not a Project
- Get Your Kitchen Running on Real Forecasts
- Sources
What Does Demand Forecasting Do for a Restaurant?
Forecasting is the practice of predicting how many covers, orders, or menu items you'll sell in a given period, then using that number to drive purchasing and staffing. For restaurants, the payoff shows up in three places: less spoilage, tighter rosters, and steadier margins.
Food cost and labor each typically run close to 30% of revenue for most restaurant operations. When forecasts are off by even 10 to 15%, that overage bleeds straight into one of those two lines. A kitchen that over-orders proteins for a Tuesday lunch it never gets eats the loss in spoilage. A manager who over-rosters for a Friday dinner that doesn't materialize eats it in idle labor hours.
Daypart-level forecasting fixes the second problem directly. Instead of scheduling a flat headcount for "dinner service," you break demand into 30 or 60-minute windows and staff to the curve, not the average.
Consider a mid-size café doing typical weekly food purchases. Cutting forecast error significantly on a handful of high-volume items can save several hundred dollars a week in avoided waste and reduced last-minute supplier runs. Multiply that across a year and the case for forecasting builds itself.
- Fewer emergency supplier orders at premium pricing
- Lower spoilage on high-cost perishables (seafood, dairy, fresh produce)
- Rosters that match actual traffic patterns by daypart
- Purchasing decisions backed by history, not the manager's memory
Getting there starts with the right cost-control habits layered on top of clean sales data.
What Data Does Restaurant Demand Forecasting Need?
A forecast is only as good as what feeds it. Before you touch a model, you need clean, unified data across five categories.
- Item-level sales history with timestamps, not just daily totals. "We sold 340 burgers last Tuesday" is far less useful than knowing the hourly breakdown.
- Channel tags separating dine-in, takeaway, delivery apps, and catering. Demand shapes differ wildly across channels, and combining them without splits hides the real pattern.
- Recipe and portion yields so covers translate into ingredient units, not just plate counts.
- Supplier pack sizes and lead times, since a forecast that says "order 22 kilograms" is useless if your supplier only sells in 25-kilogram bags.
- Event, holiday, and weather flags tied to the dates they affected, so the model can learn what drove the spike or dip.
If your point-of-sale system splits data across three separate delivery tablets and a paper docket book, your baseline is already broken before you start. Unifying every channel into one POS history is a precondition, not a nice extra.
For history length, aim for a minimum of 12 months of clean data to capture seasonal cycles properly. If you're a new location or a recently launched menu item, you likely don't have that. That's where cross-sectional forecasting helps: pooling data across similar items or locations lets a short-history item borrow patterns from comparable ones, rather than forecasting blind.
Pro Tip: Before adding any model, run a two-week audit comparing your POS export against your actual supplier invoices. Mismatches here almost always trace back to missing channel tags or unrecorded comps.
Which Forecasting Method Fits Your Restaurant?
Not every restaurant needs a machine-learning pipeline. Match the method to your data volume and how much accuracy actually matters for that item.
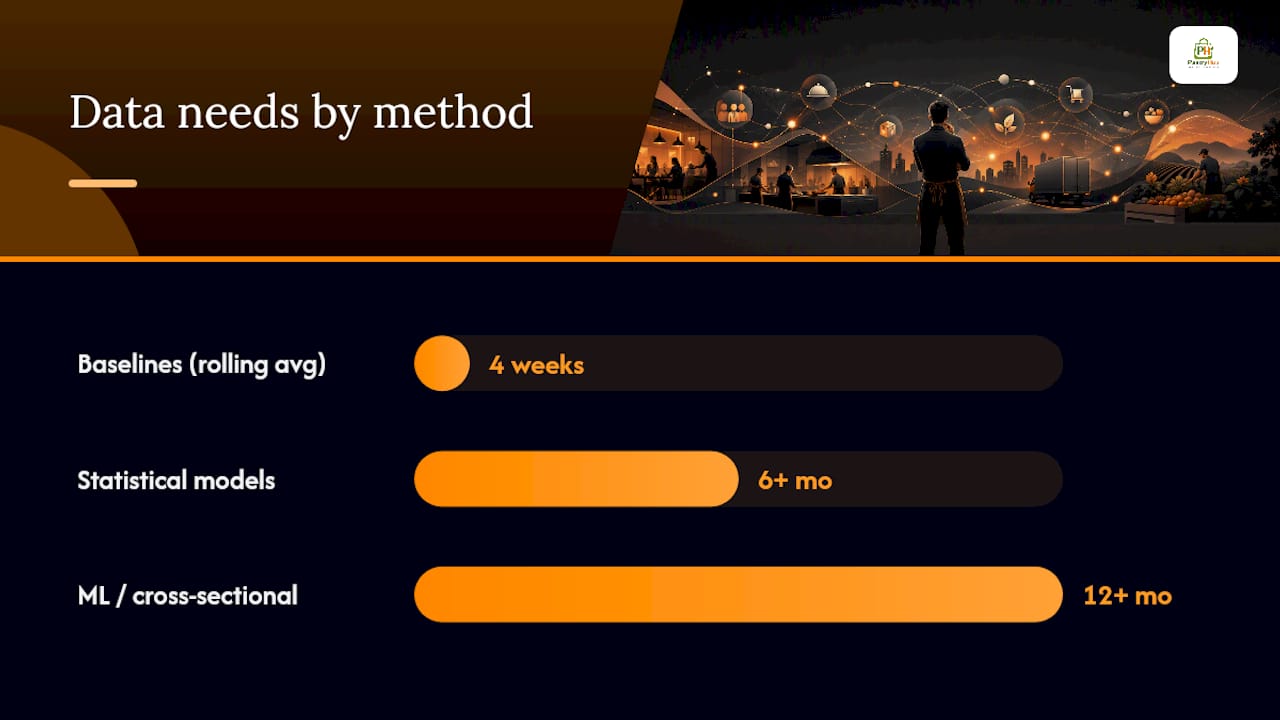
Simple baselines are the right starting point for almost everyone. A 4-week rolling average or a seasonal naive model (using "same day last week" as your prediction) requires no software beyond a spreadsheet and produces a usable benchmark within days.
Statistical models step up the sophistication once you have consistent history. Exponential smoothing and ARIMA (Autoregressive Integrated Moving Average) both capture trend and seasonality better than a flat average, and they work well for items with stable, repeating weekly patterns like a Sunday brunch special.
Machine learning and cross-sectional approaches earn their complexity only at scale. Techniques like XGBoost, LSTM networks, and Temporal Fusion Transformers (TFT) can outperform statistical benchmarks, but research confirms this only holds when trained on sufficient, well-structured data. Cross-sectional training, grouping similar menu items or locations together, addresses the short-history problem that sinks most single-item ML attempts.
- Baselines: fast setup, minimal data, moderate accuracy
- Statistical models: moderate setup, 6+ months of history, better seasonality capture
- ML/cross-sectional: higher setup cost, 12+ months or pooled data, strongest accuracy at scale
What accuracy should you expect? Well-run rolling averages often land in a moderate MAPE range for stable, high-volume items. Statistical models tend to tighten that further on seasonal products. ML models can improve on both, but only when the underlying data is deep and clean. Be skeptical of any vendor quoting a flat accuracy number without showing it on your own item-level history.
How Do You Roll Out Forecasting Step by Step?
Skip the temptation to buy an enterprise ML platform on day one. A phased rollout gets you real value in week one and compounds from there.
- Phase 1, baseline (weeks 1 to 4): Set a weekly planning cadence. Run a 4-week rolling average on your top 20 items, split by daypart. Don't touch anything more complex yet.
- Phase 2, structure (weeks 5 to 10): Layer in holiday and event flags. Split forecasts by channel. Convert your covers forecast into ingredient units using recipe yields, so purchasing orders derive directly from the forecast.
- Phase 3, advanced (month 3 onward): Cluster similar items or, if you run multiple venues, similar sites. Introduce an ML or statistical model on that cluster and run it blind against your baseline for at least four weeks before trusting it.
Once a phase is stable, push the forecast into action: auto-generate purchase orders, trigger prep lists for the kitchen, and set roster templates by daypart. Assign one owner, usually the operations manager or head chef, who reviews forecast performance weekly and adjusts par levels from there.
Pro Tip: Never retire your baseline. Even after you adopt a fancier model, keep the rolling average running in parallel as a sanity check. If the advanced model drifts wildly from the baseline, that's your early warning sign.
How Do You Measure Forecast Accuracy?
Two numbers matter more than any others: MAPE and bias.
MAPE (Mean Absolute Percentage Error) measures how far off your forecast was, on average, as a percentage of actual sales. Bias tells you the direction of that error, whether you consistently over-forecast or under-forecast a given item. A model can carry a decent MAPE while hiding a dangerous bias, consistently over-ordering the same perishable item week after week.
Track MAPE at the item level, not just in aggregate. A blended MAPE across your whole menu can look healthy while your top three perishable items are wildly inaccurate underneath it, which is exactly where waste actually happens.
- Set service-level or fill-rate targets for perishables, aiming to avoid stockouts on high-margin items without over-buffering
- Translate error directly into dollars: a known MAPE on a $2,000-weekly item tells you roughly how much waste or lost sales that error is costing
- Review dashboards weekly, tracking item-level MAPE, bias direction, and stockout incidents side by side
A free food cost calculator can help you convert a forecast miss into an actual dollar figure for your specific menu, which makes the case for tightening accuracy far more concrete than a percentage alone.
What Mistakes Break Restaurant Forecasts?
Most forecasting failures trace back to a handful of repeatable mistakes, not bad math.
- Fragmented channels: if delivery-app orders, dine-in, and takeaway live in separate systems, your baseline is calculating against incomplete history before it even starts.
- Overfitting to promotions: a model trained during a heavy discount period will wrongly assume that demand is your new normal. Keep holdout periods and build in conservative buffers around promotional weeks.
- Ignoring recipe yields: forecasting "200 covers" without converting that into actual ingredient units, accounting for portion size and prep waste, leaves your purchasing team guessing anyway.
- No feedback loop: a forecast nobody reviews just decays quietly. Set a recurring meeting, even 15 minutes weekly, to compare forecast versus actual and log what drove the miss.
Fixing the channel and yield issues alone typically resolves most of the waste reduction gap operators struggle with before they ever touch a fancier model.
How PantryHub Turns Forecasts Into Daily Action
A forecast that lives in a spreadsheet doesn't save you anything. It has to become a purchase order, a prep list, or a roster.
PantryHub was built around that gap. Unified POS ingestion pulls sales history into one place regardless of channel, so your baseline starts from accurate numbers rather than fragmented tablets. Recipe and portion tools convert covers into real ingredient quantities automatically. Low-stock alerts flag when actual consumption is trending away from forecast, and supplier ordering lets you convert a forecasted need directly into a placed order without re-entering numbers by hand.
- Unified sales history across dine-in, delivery, and takeaway channels
- Recipe yields that turn cover forecasts into ingredient-level purchasing
- AI-powered low-stock alerts tied to real consumption trends
- Supplier ordering that closes the loop between forecast and purchase order
What Do Real Forecasting Wins Look Like?
The clearest wins tend to come from operators who start small and stay disciplined about tracking.
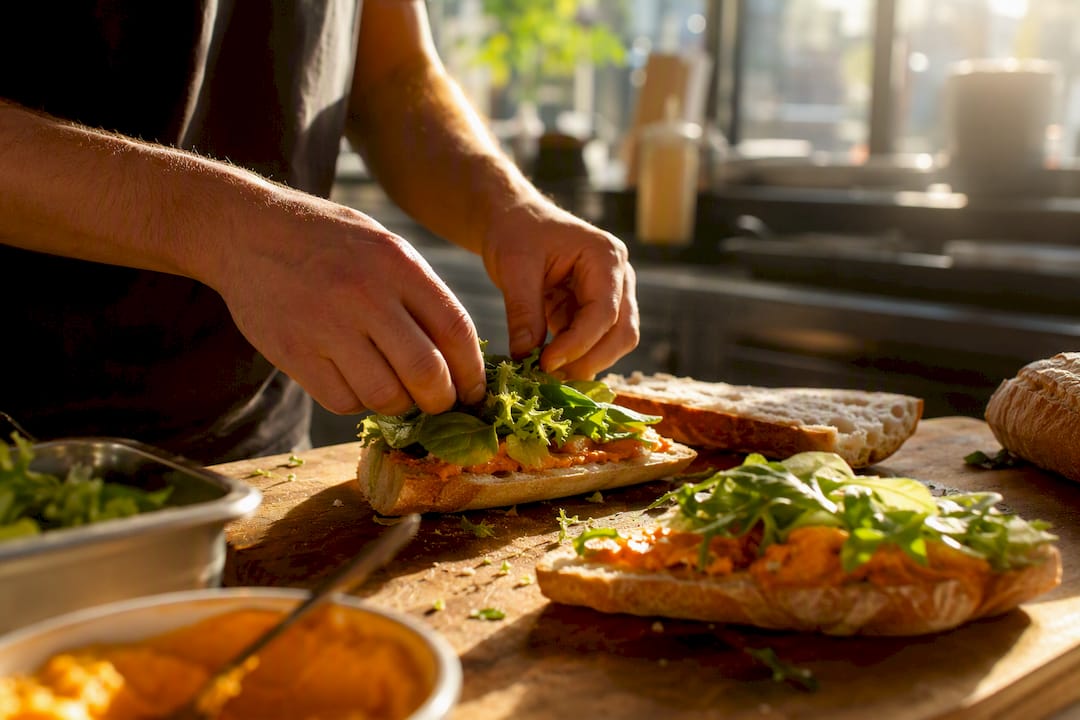
A café chain with several inner-city locations moved from a paper-based ordering system to a rolling four-week average tracked per site. Within two months, spoilage on their fresh sandwich line, previously their worst offender, dropped noticeably simply because ordering finally matched Tuesday's actual traffic instead of Saturday's.
A multi-venue pub group facing wild swings in weekend demand added event and weather flags to their forecast after noticing every rainy Friday crushed their outdoor seating covers. That single addition tightened their roster accuracy for weekend shifts within a single quarter, cutting the overtime hours they'd been quietly absorbing.
A quick-service chain running six locations used clustering to group similar-volume sites together, since none of them individually had enough history to justify a standalone model. Pooling that data let them run a shared forecast that outperformed their old per-site guesswork within the first month of testing, echoing what cross-sectional research on food datasets suggests happens when short histories get pooled correctly.
None of these required a data science team. Each started with the same phase one: clean data, a simple baseline, and a manager willing to check the numbers weekly.
A Publisher's Take: Forecasting Is a Habit, Not a Project
The biggest mistake operators make isn't picking the wrong model, it's treating forecasting as a one-time setup instead of a weekly discipline. Pilot it on one menu category or a single daypart first. Assign one person to own the review. A forecast nobody checks is just a guess with extra steps.
— Admin
Get Your Kitchen Running on Real Forecasts
PantryHub is the practical way to put everything above into daily practice, without hiring a data analyst or rebuilding your POS setup. It pulls your sales history into one place, converts covers into ingredient-level purchasing through recipe yields, and turns low-stock alerts into supplier orders with a few taps.

If you're ready to move past spreadsheets and rough guesses, check current pricing and start a free trial to see how your own sales history performs against a real baseline. For kitchens juggling counts on the floor, the mobile inventory app makes stock counts and reorder triggers something your team can handle between services, not after close.
Sources
For deeper technical grounding, AWS documents a full reference architecture for restaurant forecasting, while IEEE Xplore covers machine learning algorithms tied to inventory optimization. For seasonal demand shifts, see managing seasonal menu stock.
- Demand forecasting in restaurants using machine learning — ScienceDirect
- Cross-sectional forecasting application and clustering approaches — Politecnico di Milano thesis