

Most reported food-cost percentages are wrong, and the reason is almost always the same: teams mix fixed costs like payroll, rent, and utilities into what should be a clean, plate-level variable cost. Separate the two, and the number changes fast. In audited restaurants, correcting that single error dropped reported food cost by up to 8 to 11 percentage points — the difference between a menu that looks broken and one that's actually healthy.
The fix has two parts. First, strip payroll, rent, and utilities out of your plate cost and count only ingredients plus measured waste. Second, stop running food cost once a month. Operators who check weekly instead of monthly tend to run 3 to 5% lower on food cost, mostly because they catch price spikes before those spikes eat a full month of margin.
- Stop folding payroll and rent into your plate-level food cost calculation.
- Run a weekly COGS check: (beginning inventory + purchases − ending inventory) ÷ food sales.
- Weigh waste on your top-selling dishes for 21 days before you touch a single recipe.
Key Takeaways
Most reported food-cost percentages are inflated because operators blend fixed costs into variable plate cost and check numbers too infrequently to catch price swings.
| Point | Details |
|---|---|
| Separate fixed from variable | Keep payroll, rent, and utilities out of plate cost; this alone can shift reported food cost by 8 to 11 points. |
| Include inventory, not just purchases | Use beginning inventory plus purchases minus ending inventory, never purchases divided by sales alone. |
| Measure waste for 21 days | Unmeasured waste typically runs 4 to 7% and rarely appears anywhere until it's logged directly. |
| Run weekly, not monthly | Weekly food-cost checks correlate with food cost running 3 to 5% lower than monthly-only tracking. |
| Automate the tracking | PantryHub's inventory platform matches invoices by receipt date and updates recipe costs automatically each week. |
Table of Contents
- What Food Cost Percentage Actually Measures (And the Formula Most Operators Get Wrong)
- The 10 Most Common Food Cost Percentage Mistakes Operators Make
- A Step-by-Step Audit to Find and Fix Your Food Cost Errors
- How Inventory Software Closes the Gaps Manual Tracking Misses
- How Often You Should Measure Food Cost (And What It's Worth)
- Try PantryHub Before You Change a Single Recipe
- Frequently Asked Questions
- Sources
What Food Cost Percentage Actually Measures (And the Formula Most Operators Get Wrong)
Food cost percentage measures how much of every dollar in food sales gets consumed by ingredient cost. The formula is: (Beginning inventory + Purchases − Ending inventory) ÷ Net food sales × 100.
That's it. But a huge number of operators quietly swap it for purchases ÷ sales, which skips inventory entirely. That shortcut is misleading because it ignores inventory swings, and a big delivery right before month end can make your food cost look artificially high or low depending on when you count it. True cost of goods sold requires both beginning and ending counts, not just what you bought.
Here's a weekly example you can reproduce with your own numbers:
| Input | Amount |
|---|---|
| Beginning inventory | $8,200 |
| Purchases | $6,400 |
| Ending inventory | $7,100 |
| Net food sales | $24,500 |
| Food cost % | 27% |
That last figure comes from ($8,200 + $6,400 − $7,100) ÷ $24,500 × 100.
A few input rules matter more than people think: use net food sales (comps, voids, and staff meals removed), match purchases to the date goods actually arrived rather than the invoice date, and separate bar and beverage sales from food sales entirely. When you want to diagnose a specific dish rather than the whole kitchen, switch to theoretical food cost, which prices out a standardized recipe card instead of relying on purchase totals. PantryHub's free food cost calculator runs this exact formula so you can sanity-check your own math in minutes.
The 10 Most Common Food Cost Percentage Mistakes Operators Make
1. Mixing fixed and variable costs. Payroll, rent, and utilities do not belong in plate cost. A Masterestaurant audit of 180 restaurants found 73% made this exact error, and correcting it dropped average reported food cost from 38% to 27%. Fix: keep a strictly variable ingredient column and a separate break-even column for fixed overhead.
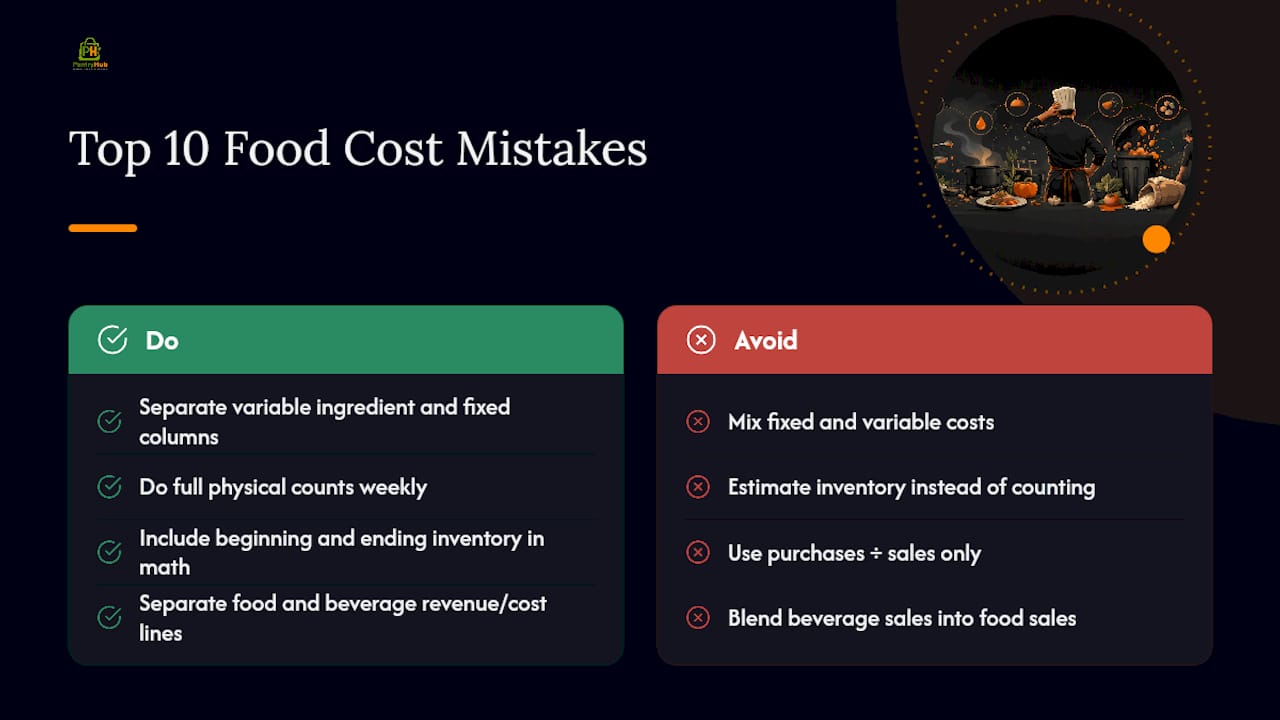
2. Skipping physical counts. Estimating inventory instead of counting it inflates or deflates both numerator and denominator. Fix: full physical count, no guessing, every week if you can manage it.
3. Using purchases-only math. Purchases ÷ sales ignores what's sitting in your walk-in. Fix: always include beginning and ending inventory in the calculation.
4. Matching invoices by invoice date, not receipt date. Goods ordered in one week but delivered the next get counted in the wrong period, skewing weekly comparisons. Fix: log purchases the day they physically arrive.
5. Blending beverage sales into food sales. Bar margins run very differently from kitchen margins, and combining them muddies both. Fix: separate revenue and cost lines for food and beverage.
**6. Yield-test anything with meaningful trim loss.
7. Letting recipe costs go stale. Roughly 61% of recipes end up mis-costed by at least 10% because nobody updates them after a supplier price change. Fix: recalculate your top 20 sellers every 15 days.
8. Ignoring measured waste and theft. Unmeasured kitchen waste typically runs 4 to 7% and rarely shows up anywhere in the math until it's already eaten your margin. Fix: weigh trim, spoilage, and comps for three weeks straight.
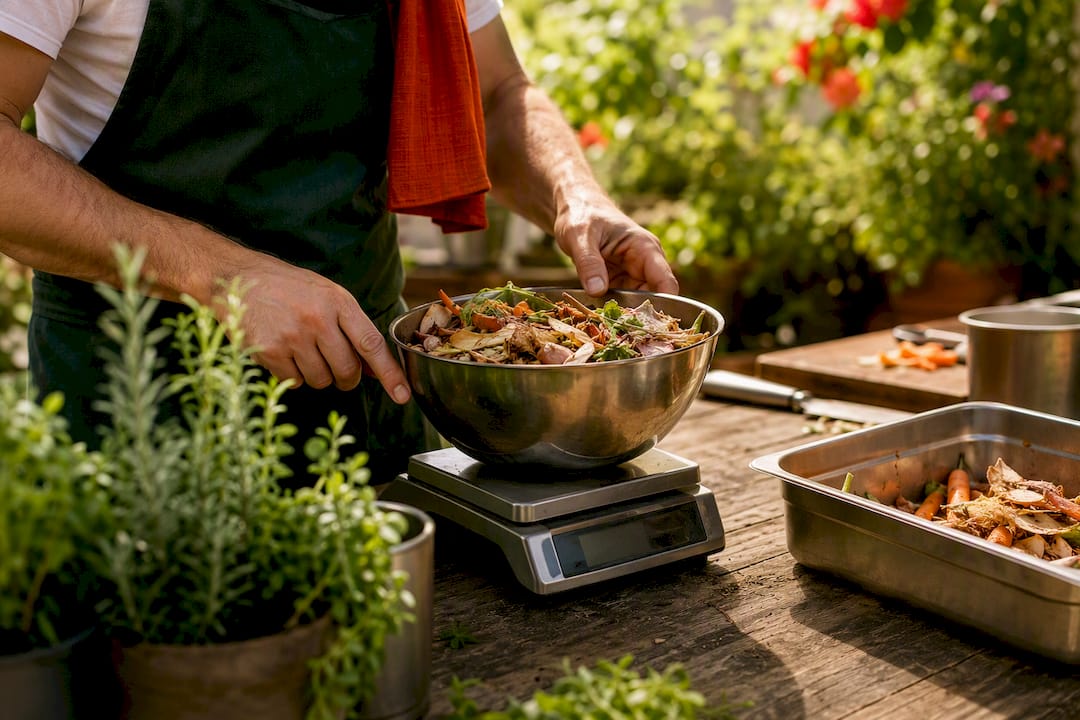
9. Portioning drift. A cook who scoops a slightly heavier ladle every shift is quietly rewriting your recipe cost. Fix: spot-check portions with a scale during service, not after.
10. Ignoring sales mix and promotions. A discounted combo or a happy-hour special changes your blended food cost even when nothing in the kitchen changed. Fix: track food cost by category, not just as one blended number.
Pro Tip: Audit the roughly 20% of dishes that generate 80% of your sales first. Fixing those has the biggest immediate effect on your reported number.
A Step-by-Step Audit to Find and Fix Your Food Cost Errors
Run this over the next 21 to 60 days, in order:
- Sunday night, week one: Full physical inventory count, no shortcuts, matched against system counts.
- Monday, week one: Reconcile every invoice by receipt date, not invoice date, for the past four weeks.
- Days 1 to 21: Weigh waste and trim daily on your priority SKUs, especially proteins and anything with high shrink.
- Week two: Run theoretical food cost against actual food cost for your top 20 items. A variance above roughly 1.5% points to a process problem; above 3% usually means real leakage, whether that's theft, over-portioning, or bad yields.
- Week two to three: Spot-check portioning on the same top 20 items during live service.
- Ongoing: Reconcile comps, voids, and staff meals in your POS weekly so net food sales stays accurate.
Prioritize this list by impact: inventory count accuracy first, then portioning, then waste tracking, then invoice matching, then recipe yields, then sales mix. Fixing the first two usually moves the needle more than anything else on the list.
Pro Tip: Recalculate your top 20 menu items every 15 days and fix your par levels before you renegotiate with a supplier. Ordering the right amount solves more problems than a better price does.
How Inventory Software Closes the Gaps Manual Tracking Misses
Every mistake above traces back to the same root problem: data that's late, disconnected, or estimated instead of measured. Software built for kitchens closes that gap directly.
- Ingredient-level stock tracking that updates the moment stock is received, not at month end.
- Automatic invoice matching by receipt date, so purchases land in the correct week.
- Recipe and yield versioning that flags a recipe the moment a supplier price moves.
- Waste logging tied to specific SKUs, not a vague monthly guess.
- Weekly food-cost dashboards that surface variance before it becomes a pattern.
A typical workflow looks like this: goods arrive, inventory updates on receipt date, cost updates automatically, the recipe recalculates, and a weekly report lands in your inbox. Operators who standardize recipes and start measuring waste typically recover several food-cost percentage points within 60 to 90 days, not years.
Pro Tip: Run PantryHub's free food cost calculator against your last month's numbers before you change a single process. It tells you exactly where the gap is coming from.
How Often You Should Measure Food Cost (And What It's Worth)
High-variability venues, anywhere protein prices swing weekly, should run food cost every week. Recalculate your top 20 dishes every 15 days. If weekly counts aren't realistic yet, do a full inventory monthly at minimum, and run a 21-day waste log the first time you audit any station.
- Weekly food-cost runs for volatile menus.
- 15-day recipe recalculation on top sellers.
- Monthly full inventory as the floor, not the goal.
- 21-day waste-measurement window to start any new audit.
Statistic Callout: Unmeasured kitchen waste typically runs 4 to 7% of food cost. Catching even half of that shows up in your bottom line within weeks, not seasons.
Expect quick wins on measurement and waste within 2 to 8 weeks. Meaningful, sustained margin improvement from recipe and inventory discipline usually shows up in the 60 to 90 day range.
What I See Wrong in Almost Every Kitchen Audit
The recurring issue isn't poor buying. It's column confusion, fixed costs bleeding into variable plate cost. Fix that one habit before anything else, and run short, disciplined audits instead of one big annual scramble.
Try PantryHub Before You Change a Single Recipe
Every mistake in this list comes down to the same thing: data that arrives late or gets estimated instead of measured. PantryHub was built by kitchen operators specifically to close that gap, with receipt-date invoice matching, ingredient-level stock tracking, and a weekly food-cost dashboard that does the math this article just walked through, automatically, every week, without a spreadsheet.
During a trial, test three things: match invoices by receipt date instead of invoice date, run a weekly food-cost check instead of a monthly one, and log waste on your top SKUs for a couple of weeks. Those three habits catch most of the mistakes covered above. Start with the free food cost calculator to see where your current number sits, then explore PantryHub's hospitality inventory software to see how the same numbers update automatically once receiving, recipes, and waste logging are connected.
Frequently Asked Questions
What is the standard food cost percentage formula? (Beginning inventory + Purchases − Ending inventory) ÷ Net food sales × 100. Purchases-only math skips inventory swings and gives a distorted number.
Why do most food cost percentage mistakes happen? The most common driver is mixing fixed costs like payroll and rent into what should be a pure variable plate cost, which can inflate the reported number by 8 to 11 percentage points.
How often should I calculate food cost percentage? Weekly for any venue with volatile ingredient pricing. Operators running weekly checks tend to sit 3 to 5% lower than those checking monthly.
What's a healthy food cost percentage for a single dish?
How do seasonal price changes affect food cost percentage? Rising input costs squeeze margin unless recipes and menu prices get revisited regularly. Even large chains adjust pricing when ingredient costs shift nationally, and independent kitchens should recalculate top sellers just as often.
Sources
- Food Cost Mistakes vs the Right Method · Masterestaurant (2026)
- Food Cost Percentage: The One Number Most Restaurants Are Calculating Wrong | Fennec Press Blog
- Restaurant Food Cost Percentage for Operators 2026
- The Step-by-Step Guide to Accurate Restaurant Recipe Costing
- Restaurant Food Cost Calculator: Run the Math in Five Minutes – Protecting the Bottom Line (2026)