

A hospitality inventory benchmark is a standardized performance target that measures whether your stock levels, cost ratios, and waste rates fall within acceptable industry ranges. For Australian operators, the most authoritative source is the Australian Taxation Office, whose 2023–24 small business benchmarks show cost of sales to turnover ranging from 31% to 39% for restaurants depending on business size. Knowing where your numbers sit against those targets is the foundation of every sound inventory decision you make. Pantryhub was built specifically to give Australian hospitality managers that visibility, in real time, without spreadsheets.
What is a hospitality inventory benchmark in Australia?
A hospitality inventory benchmark is a numeric target or ratio that tells you whether your stock performance is normal, too costly, or dangerously lean. The term "inventory benchmark" is the everyday phrase, but the formal industry concept is inventory performance standard, which covers cost ratios, variance thresholds, turnover rates, and par levels together.
The ATO publishes annual small business benchmarks for the hospitality sector. For restaurants, the 2023–24 benchmark data shows cost of sales sitting at 31%–36% of turnover for businesses above $1 million in revenue, and up to 39% for smaller casual restaurants. If your cost of sales is consistently above 39%, your inventory is either overpriced, over-portioned, or leaking through waste and theft.

These ratios are not suggestions. The ATO uses them to flag businesses that may be underreporting income or overclaiming deductions. That makes them doubly important: they are both an operational target and a compliance signal.
Beyond the ATO figures, Australian hospitality managers track three additional benchmark categories:
- Inventory variance: The gap between theoretical usage and actual stock on hand. A variance above 3% signals unrecorded waste, theft, or poor portion control.
- Par levels: The minimum stock quantity needed to cover a set period without running out. Par levels set by consumption data outperform par levels set by intuition every time.
- Stock turnover rate: How many times your inventory cycles through in a given period. A low turnover rate means capital is sitting idle on shelves.
Pro Tip: Cross-reference your cost of sales ratio against the ATO benchmark for your revenue tier every quarter. A single percentage point above the upper range on a $2 million turnover business equals $20,000 in unaccounted cost.
| Benchmark type | Target range | Red flag |
|---|---|---|
| Cost of sales to turnover (over $1M) | 31%–36% | Above 39% |
| Cost of sales to turnover (under $1M) | Up to 39% | Consistently above 39% |
| Inventory variance | Below 3% | Above 3% |
| Stock counting error rate (manual) | Below 1% (digital) | 5%–10% (manual) |
How does benchmarking hospitality inventory improve efficiency?
Benchmarking turns a vague sense that "costs feel high" into a specific, fixable number. When you measure variance, turnover rates, and cost ratios against defined targets, you can pinpoint exactly where money is leaving the building.
The impact of proper inventory control is significant. Effective inventory management reduces losses from 15%–20% down to 3%–5%. For a mid-size restaurant or hotel, that difference represents tens of thousands of dollars per year. Larger properties that adopt digital inventory systems report stock-related cost savings of AUD 100,000–300,000 annually.
Digital systems drive most of that improvement. Manual stock counting carries an error rate of 5%–10%, while digital systems bring that below 1%. Lower error rates mean your par levels reflect reality, your orders are accurate, and your cost of sales ratio stays within the ATO benchmark range.
Benchmarking also exposes two costly patterns that are easy to miss without data:
- Overstocking slow movers: Tying up cash in items that sit for weeks, increasing spoilage risk and storage costs.
- Understocking fast movers: Triggering expensive ad hoc purchases from secondary suppliers at higher prices.
Hospitality managers who rely on intuition rather than consumption data consistently fall into both traps. The fix is not more experience. The fix is better data.
Pro Tip: Set par levels using a rolling 4-week consumption average, not last week's gut feel. Seasonal venues should recalculate par levels at the start of each peak period.
What practical steps do Australian hospitality businesses use to benchmark inventory?
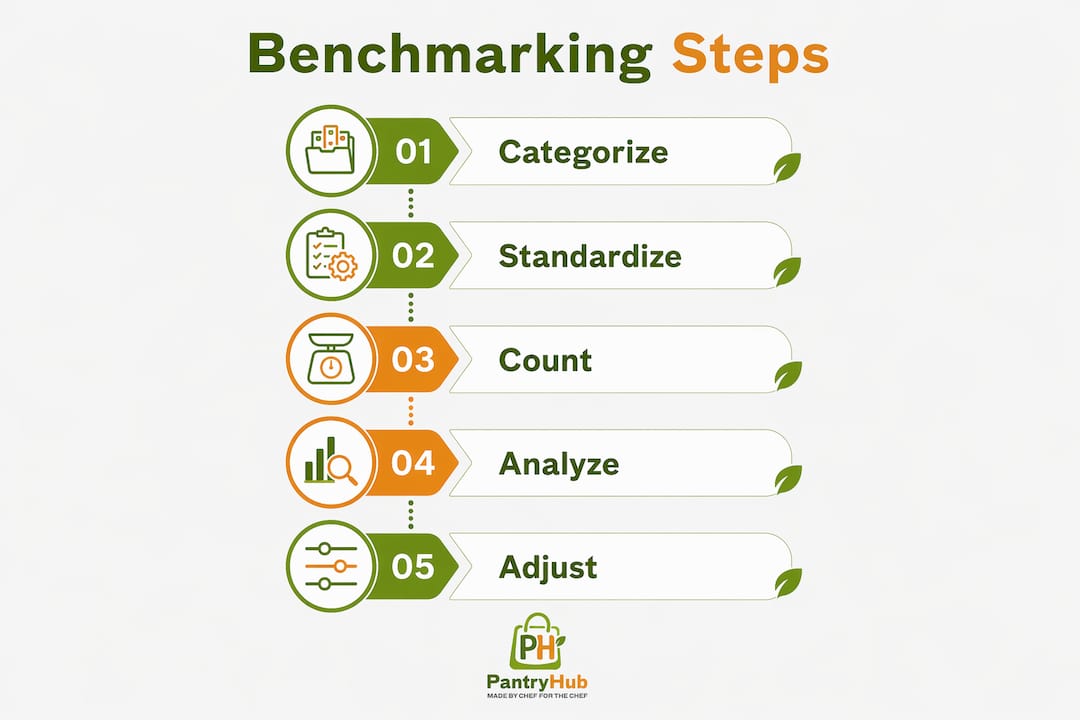
Applying hospitality inventory standards in Australia starts with categorizing your stock by department and risk level. Food and beverage, housekeeping, and maintenance each have different turnover rates and cost profiles. Treating them as one undifferentiated pile produces benchmarks that mean nothing.
Categorize and prioritize stock
Segment inventory into three tiers based on value and velocity. High-value, high-movement items like proteins and spirits need daily micro-counts. Daily micro-counts on high-value items detect loss earlier and more reliably than monthly audits alone. Mid-tier items warrant weekly counts. Low-value, slow-moving items can be audited monthly.
This tiered approach also applies to linen in hotel and accommodation operations. The standard three-par rule requires one set in use, one in the wash, and one clean and ready. In practice, a 10%–20% buffer above that standard is necessary during peak periods to cover laundry delays and linen degradation.
Standardize specifications across sites
Multi-site operators face a specific challenge: each location may order slightly different products, making consolidated benchmarking impossible. Standardizing specifications such as towel weights, plate sizes, and packaging formats across all sites reduces the number of SKUs you manage and consolidates purchasing power. Fewer SKUs mean cleaner data, which means benchmarks you can actually trust.
Choose the right counting method
The table below compares manual and digital stock management approaches across the metrics that matter most for benchmarking hospitality inventory.
| Factor | Manual counting | Digital system |
|---|---|---|
| Counting error rate | 5%–10% | Below 1% |
| Real-time visibility | No | Yes |
| Automated reordering | No | Yes |
| Variance analysis | Slow, error-prone | Immediate |
| Multi-site consolidation | Difficult | Built-in |
Pro Tip: For linen-heavy operations, tag each batch with a purchase date. This lets you track degradation rates and replace stock before it falls below guest-facing quality standards, rather than after a complaint.
What are the common challenges in applying inventory benchmarks in Australia?
The biggest challenge is not understanding benchmarks. The biggest challenge is collecting data clean enough to benchmark against. Garbage in, garbage out applies directly to hospitality inventory.
The most common errors Australian operators make include:
- Setting par levels by guesswork. Managers who rely on experience rather than consumption data chronically overstock slow movers and understock fast movers. Both errors cost money.
- Ignoring variance analysis. Counting stock is not the same as benchmarking it. Variance analysis compares theoretical usage against actual stock levels. Without it, you cannot tell whether a discrepancy is waste, theft, or a counting error.
- Failing to adjust for peak seasons. A par level that works in a quiet February becomes dangerously low in a peak December. Benchmarks need to be recalibrated before each major trading period, not once a year.
- Treating benchmarks as fixed targets. The ATO updates its small business benchmarks annually. Your own benchmarks should update with your menu changes, supplier price shifts, and trading pattern changes.
Linen management in hotels adds another layer of complexity. Emergency replacements during peak periods can blow out the linen budget if buffer stock is not planned in advance. The 10%–20% buffer rule exists precisely because operational reality does not match theoretical par calculations.
Pro Tip: Run a variance analysis at the end of every trading week, not just at month-end. Weekly variance reports catch problems while they are still small enough to fix without a full investigation.
Key Takeaways
Australian hospitality inventory benchmarks are most useful when treated as dynamic performance tools updated with real consumption data, not as static compliance checkboxes.
| Point | Details |
|---|---|
| ATO benchmark ranges | Cost of sales should sit between 31%–39% of turnover depending on restaurant size. |
| Variance threshold | Inventory variance above 3% signals waste, theft, or poor portion control. |
| Digital counting accuracy | Digital systems reduce stock counting errors from 5%–10% down to below 1%. |
| Par level discipline | Set par levels from rolling consumption data, not intuition, and recalibrate each peak season. |
| Linen buffer rule | Hotels need a 10%–20% buffer above standard three-par linen levels during peak periods. |
Why most operators benchmark too late
I have worked with enough hospitality operators to know the pattern: benchmarking starts after a bad month, not before one. A cost of sales ratio creeps above 40%, someone panics, and suddenly everyone is counting stock daily. The problem is that reactive benchmarking only tells you how bad things got. It does not prevent the next blowout.
The operators who consistently stay within ATO benchmark ranges share one habit: they treat variance analysis as a weekly discipline, not a crisis response. They do not wait for the monthly P&L to tell them something is wrong. They know by friday afternoon whether their food cost is tracking on target.
The other thing I have seen consistently is the gap between what managers think their par levels are and what the data actually shows. One café owner I spoke with was convinced she was running a tight kitchen. When she moved to a digital system and pulled four weeks of consumption data, she found she was overstocking three key proteins by nearly 30% every week. That was not a knowledge problem. That was a data problem.
Benchmarking hospitality inventory in Australia is not complicated. It requires consistent counting, honest variance analysis, and the discipline to update your targets when the business changes. The tools exist. The ATO has published the reference points. The only missing piece, for most operators, is the system that connects the data to the decision.
How Pantryhub helps Australian operators hit their benchmarks

Pantryhub is built for exactly the kind of benchmarking this article describes. The platform gives Australian restaurants, cafés, and bars real-time inventory tracking with automated low-stock alerts, par level management, and variance reporting in one place. You set your targets, and Pantryhub flags when you drift outside them.
For multi-site operators, Pantryhub consolidates stock data across all locations so you can benchmark each site against the same standards. Automated ordering removes the ad hoc purchase problem entirely. Detailed reporting connects your stock movements directly to your cost of sales ratio, so you always know where you stand against the ATO benchmark ranges. Pantryhub starts from A$39 per month. You can view full pricing on the website.
FAQ
What is a hospitality inventory benchmark in Australia?
A hospitality inventory benchmark is a performance target for stock management, covering cost of sales ratios, variance thresholds, and par levels. The ATO publishes annual benchmarks showing Australian restaurants should keep cost of sales between 31%–39% of turnover.
What does inventory variance mean in hospitality?
Inventory variance is the difference between theoretical stock usage and actual stock on hand. A variance above 3% signals unrecorded waste, theft, or portion control failures and requires immediate investigation.
How often should Australian hospitality businesses count stock?
High-value items like proteins and spirits should be counted daily. Mid-tier items warrant weekly counts, and low-value items can be audited monthly. Weekly variance analysis catches problems before they compound.
What is the three-par rule for linen inventory?
The three-par rule means holding one set of linen in use, one in the wash, and one clean and ready. Hotels should add a 10%–20% buffer above this standard during peak periods to cover laundry delays.
How do digital inventory systems improve benchmark accuracy?
Digital systems reduce stock counting error rates from 5%–10% with manual methods to below 1%. That accuracy makes par levels, variance analysis, and cost of sales calculations reliable enough to benchmark against ATO standards.