

Running a fish and chips operation means you're working with some of the most unforgiving ingredients in foodservice. Fish and chips inventory tracking is where most operators quietly lose money, not at the fryer, but in the stockroom. Seafood spoils fast, batter absorbs oil differently batch to batch, and chips shrink during cooking in ways that throw off your numbers. Without a structured system, you're guessing at par levels, over-ordering to feel safe, and writing off product that should have been profit. This guide covers the exact setup, execution, and measurement steps that fix that.
Table of Contents
- Key Takeaways
- Fish and chips inventory tracking: setting the foundation
- How to execute real-time tracking in your operation
- Common mistakes that break your tracking system
- Measuring whether your tracking is actually working
- My honest take on inventory tracking in seafood operations
- How Pantryhub helps fish and chips operators take control
- FAQ
Key Takeaways
| Point | Details |
|---|---|
| Categorize by cost tier | Sort inventory into proteins, dry goods, and supplies to set counting frequencies that match real risk. |
| Map recipe yields accurately | Account for batter absorption and raw-to-cooked weight loss to align theoretical and actual usage. |
| Integrate POS with inventory | Connect your point-of-sale data to your stock database so sales automatically deplete inventory in real time. |
| Log waste at the source | Station-level waste logging reduces spoilage and creates the data needed to find and fix loss patterns. |
| Track variance weekly | Regular variance reviews catch recipe drift, portioning errors, and supplier discrepancies before they compound. |
Fish and chips inventory tracking: setting the foundation
Before you touch any software or counting sheet, you need to get the structure right. Most operators skip this step and wonder why their numbers never add up.
Categorize your stock by cost and risk
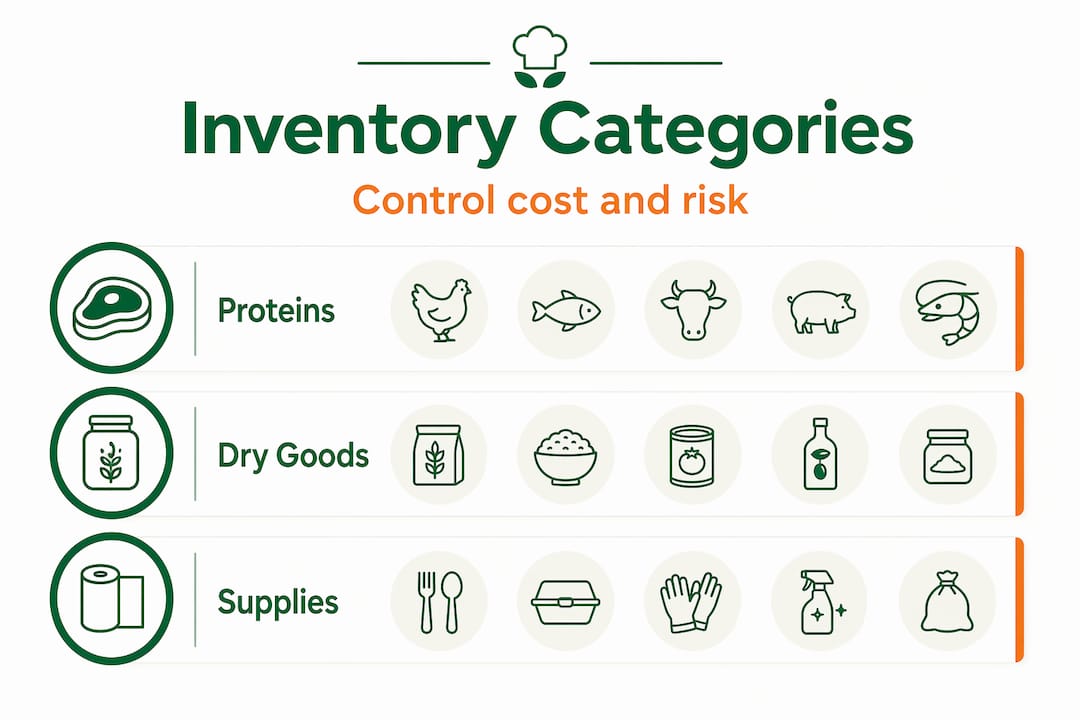
Not every item in your kitchen deserves the same attention. A tiered approach, commonly called ABC categorization, focuses your resources where they matter most. In a fish and chips context, that breaks down like this:
- Proteins (A tier): Fresh fish fillets, prawns, scallops. These are your highest-cost, most perishable items. Count them daily.
- Dry goods (B tier): Flour, batter mix, oil, salt, vinegar, frozen chips. Count these weekly.
- Supplies (C tier): Packaging, napkins, condiment sachets. Monthly counts are sufficient.
This structure alone cuts the time your team spends counting while keeping your most expensive stock under tight control.
Choose the right tools for your operation
A spreadsheet can work for a single-location shop with low volume, but it breaks down fast when you're running multiple fryers, multiple shifts, or an online ordering channel alongside your counter service. The real threshold is whether your tool can connect to your point-of-sale system. Without that connection, you're always entering data manually, and manual entry means errors.
For most fish and chips operators, a dedicated restaurant inventory platform that integrates with your EPOS is the practical middle ground between a spreadsheet and a full ERP system.
Define par levels based on actual sales velocity
Par levels set from gut feel are one of the most common causes of over-ordering. Your par level for fresh fish should be calculated from your average daily usage over the past two to four weeks, plus a lead time buffer that accounts for your supplier's delivery schedule. If your supplier delivers every two days and you use 15 kg of cod per day, your par level should sit around 35 to 40 kg, not 60 kg.
Map your recipe yields before you track anything
This is the step most operators skip, and it costs them the most. Recipe yield mapping means documenting exactly how much raw fish goes into each portion after trimming, how much batter your fish absorbs during frying, and what the cooked weight of your chips is compared to the raw weight. A standard battered fish portion might start as 180g of raw fillet but require 220g of raw fish once you account for trimming loss. If your inventory system tracks 180g per sale but you're actually using 220g, your variance will never close.
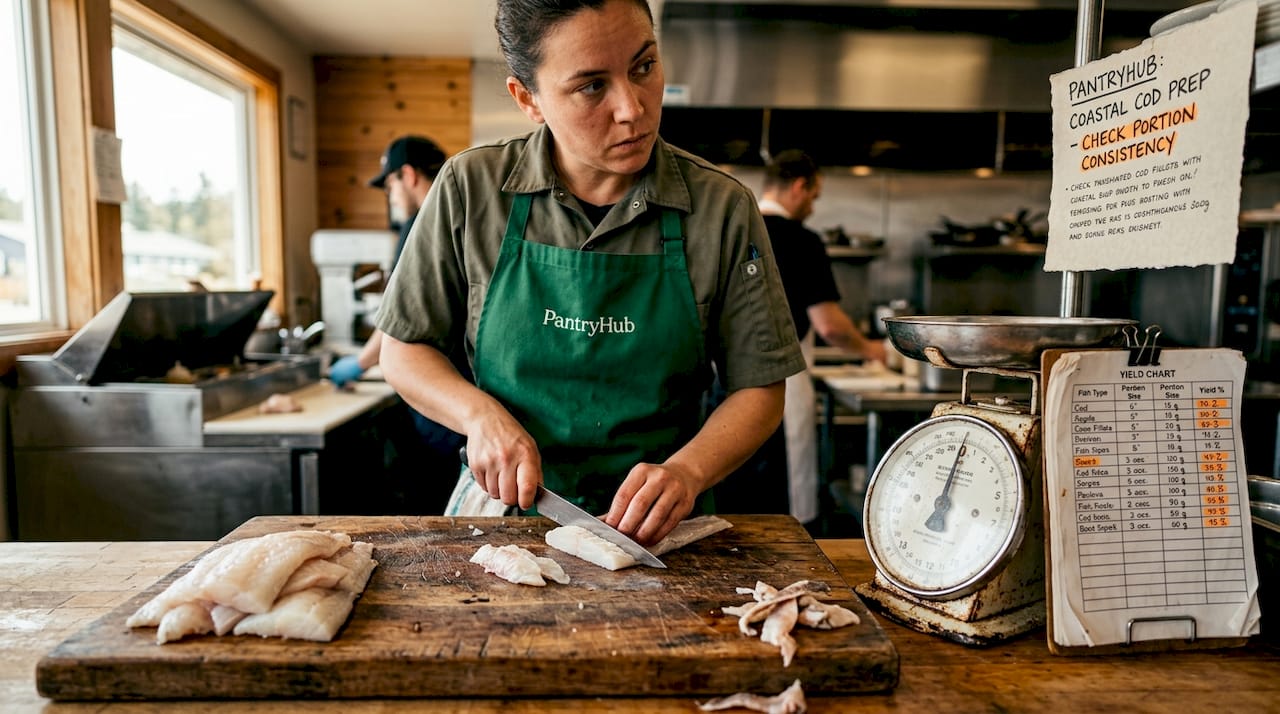
Pro Tip: Weigh and document your yields for each protein at least once per quarter. Seasonal fish quality changes affect trimming losses more than most operators expect.
Set up waste logging stations at the prep area, the fryer, and the service counter. Each station has a different waste profile, and you need to capture all three to get an accurate picture.
How to execute real-time tracking in your operation
With the foundation in place, the execution phase is where fish and chips inventory tracking actually starts saving you money.
Step-by-step implementation
-
Connect your POS to your inventory database. Every sale should automatically reduce stock based on the recipe yield you mapped. Systems that update inventory every 15 minutes via POS transactions give you near real-time visibility without requiring manual input after every order.
-
Use mobile or tablet-based counting apps. Paper count sheets get lost, misread, and entered late. Mobile apps feed counts directly into your inventory database the moment a team member submits them. This is especially useful for seafood items where you need daily accuracy.
-
Set automated reorder triggers. Once your par levels are configured, your system should generate a purchase order automatically when stock drops below the threshold. Par levels tied to sales velocity and lead time buffers eliminate the over-ordering that drives up food costs and spoilage.
-
Match invoices to purchase orders on delivery. When a supplier delivers, your team should verify quantities and prices against the original order. Invoice discrepancies above $5 per line item should trigger an alert so you catch short deliveries and pricing errors before they disappear into the books.
-
Log every waste event by category. Spoilage, trim waste, cooking errors, and over-portioning are all different problems with different solutions. Categorizing waste at the point of logging gives you the data to act on each one separately.
| Waste category | Common cause | Corrective action |
|---|---|---|
| Trim waste | Poor fish quality or inconsistent prep | Adjust yield mapping, review supplier |
| Spoilage | Over-ordering or poor rotation | Tighten par levels, enforce FIFO |
| Cooking errors | Staff training gaps | Portioning guides, fryer calibration |
| Over-portioning | No portion control tools | Scales at every station |
Queens Fish & Chips used EPOS integration with online ordering to maintain consistent stock across multiple locations, which meant their inventory reflected every sale regardless of whether it came through the counter or a delivery app.
Pro Tip: If you run both in-store and online ordering, make sure both channels feed into the same inventory database. Separate systems create blind spots that lead to selling out of items you thought you had in stock.
Common mistakes that break your tracking system
Even operators who set up a solid system run into problems. Most of them are predictable and fixable.
The biggest one is recipe drift. Your team starts using slightly more fish per portion, or the batter mix ratio shifts because someone eyeballs it instead of weighing it. Over weeks, recipe drift causes significant variance between what your system says you should have used and what you actually used. The fix is a quarterly yield audit where you physically cook and weigh a batch to verify your recipe data is still accurate.
Inaccurate manual counts are the second most common issue. One team member counts frozen chips as cases, another counts them as individual bags. Without a standardized unit of measure documented for every item, your counts will never match. Build a one-page count reference sheet and post it at every counting station.
Batch yield variability is a problem specific to seafood operations. A box of fresh cod from one supplier delivery might yield 78% after trimming. The next delivery might yield 72%. If your system uses a fixed yield percentage, those six points of difference accumulate into a meaningful variance over a month.
"The gap between theoretical and actual usage is where your profit disappears. If you can't explain the variance, you can't fix it. Start with your recipe yields and work outward from there."
Maintaining data integrity across multiple locations adds another layer of complexity. Each site may have different portion sizes, different suppliers, or different waste rates. Your inventory system needs to support location-level configuration rather than forcing every site into the same template.
Measuring whether your tracking is actually working
Setting up a system is only half the job. You need to know if it's delivering results.
The primary metric is inventory variance, which is the difference between your theoretical usage (based on POS sales and recipe yields) and your actual usage (based on physical counts). A well-run fish and chips operation should target variance below 3% for proteins and below 5% for dry goods. Anything above that points to a specific problem worth investigating.
Mobile count integration with real-time variance alerts means you don't have to wait until the end of the week to know something is off. Set alert thresholds so your manager gets a notification the same day a count falls outside the expected range.
| Metric | Target | Review frequency |
|---|---|---|
| Protein inventory variance | Below 3% | Weekly |
| Dry goods variance | Below 5% | Weekly |
| Waste as % of food cost | Below 4% | Weekly |
| Order accuracy rate | Above 98% | Per delivery |
| Food cost % change | Downward trend | Monthly |
Waste logging, when done consistently, produces measurable results quickly. Operations that implement a structured waste logging interface see logged waste drop by 31% within 60 days. The reason is simple: when staff know waste is being recorded and reviewed, behavior changes.
Pro Tip: Run a monthly food cost comparison against the same period in the prior year. Inventory tracking improvements should show up as a downward trend in food cost percentage within 60 to 90 days of implementation.
Beyond cost savings, better tracking improves freshness. When you order smaller quantities more frequently because your par levels are accurate, your fish arrives fresher and your customers notice.
My honest take on inventory tracking in seafood operations
I've worked with enough fish and chips operators to know that the biggest barrier to good inventory tracking isn't the software. It's the belief that seafood operations are too unpredictable to track accurately.
In my experience, that belief is exactly backwards. Seafood operations need more precision, not less, precisely because the variables are harder to control. The answer isn't to give up on tracking. It's to build a system that accounts for those variables from the start, which means yield mapping, waste logging, and variance reviews as non-negotiable weekly habits.
What I've found actually changes behavior on the floor is waste logging. When a prep cook knows that every trim loss gets recorded and reviewed, they start being more careful with the knife. That's not surveillance. It's accountability, and it works.
The technology adoption hurdle is real. I've seen operators spend money on software and then revert to spreadsheets within three months because the setup felt too complex. The fix is to start with one protein, one recipe, and one counting frequency. Get that right before you expand. A partial system that your team actually uses beats a complete system that nobody touches.
What I've learned is that the operators who see the fastest results are the ones who treat inventory tracking as a kitchen discipline, not an accounting exercise. The numbers live in the kitchen, not in the office.
— Admin
How Pantryhub helps fish and chips operators take control

Pantryhub is built specifically for hospitality operations that need more than a spreadsheet but don't want the complexity of an enterprise system. For fish and chips venues, that means EPOS integration that automatically depletes stock based on mapped recipe yields, mobile counting tools your team can use at the fryer or the prep bench, and automated purchase orders that trigger when stock hits your configured par levels.
The waste logging feature lets you categorize losses by station and type, giving you the weekly reports you need to spot patterns and act on them. Invoice matching flags discrepancies on delivery so you're never paying for stock you didn't receive. Whether you run one location or several, Pantryhub's hospitality inventory software gives you real-time visibility across your entire operation from a single dashboard. Check the pricing plans to find the tier that fits your operation, or book a demo to see how it works with your current EPOS setup.
FAQ
What is fish and chips inventory tracking?
Fish and chips inventory tracking is the process of monitoring stock levels, usage, and waste for all ingredients in a fish and chips operation, including fresh fish, batter, oil, and chips. It typically combines physical counts, POS-linked depletion, and waste logging to give operators accurate, real-time stock data.
How often should I count fresh fish inventory?
Fresh fish and other high-cost proteins should be counted daily due to their short shelf life and high cost per unit. Dry goods like flour and frozen chips can be counted weekly without meaningful loss of accuracy.
Why does my actual fish usage never match my theoretical usage?
The most common cause is inaccurate recipe yield data. If your system doesn't account for trimming losses and batter absorption, your theoretical usage will consistently underestimate what you actually use. Quarterly yield audits and updated recipe data close this gap.
Can I track inventory across multiple fish and chips locations?
Yes. Systems that support multi-site inventory management allow each location to maintain its own par levels and counts while feeding data into a central dashboard. This lets you compare performance across sites and identify locations with higher-than-average waste.
How quickly will inventory tracking reduce my food costs?
Operations that implement structured waste logging typically see measurable reductions within 60 days. Broader food cost improvements from accurate par levels and reduced over-ordering usually show up in monthly food cost reports within 60 to 90 days of consistent use.