

An effective Adelaide bar stock management checklist is a step-by-step system that tracks every bottle, measures every partial, and converts raw counts into variance data that protects your margins. In the industry, this process is formally called bar stocktaking or bar inventory management, and the distinction matters: counting bottles is data collection, but variance analysis reveals control. Adelaide bars face the same pressures as any hospitality venue, from supplier lead times to staff pour habits, and a well-built checklist is the most direct tool for addressing all of them. This guide gives you a practical, itemized checklist built around weekly counting cycles, precise measurement methods, and category-specific tracking.
1. What an Adelaide bar stock management checklist must include
A bar stock management checklist is not a single list of products. It is a structured procedure covering when to count, where to count, how to measure, and what to compare afterward. The checklist exists to produce comparable data across weeks, not just a snapshot of what is on the shelf today.
The core components of any effective Adelaide bar supplies checklist are:
- Weekly count schedule: Set a fixed day and time, ideally before opening or after close, and hold to it every week without exception.
- Full location coverage: Count every bottle in every storage location, including the back bar, speed rail, walk-in cooler, and dry stock room.
- Partial bottle measurement: Use a kitchen scale or consistent visual fractions to record partials. The method matters less than applying it the same way every time.
- Category separation: Track spirits, beer, wine, and mixers as distinct groups so variance can be traced to a specific category.
- Par level documentation: Record the minimum quantity needed before reordering for each SKU.
- Variance comparison: After counting, compare actual usage to theoretical usage derived from your POS sales data.
Pro Tip: Set your count schedule to the same 30-minute window each week. Even a two-hour shift in timing can affect partial bottle readings and skew your week-over-week comparisons.
2. How to count full bottles and partial bottles accurately
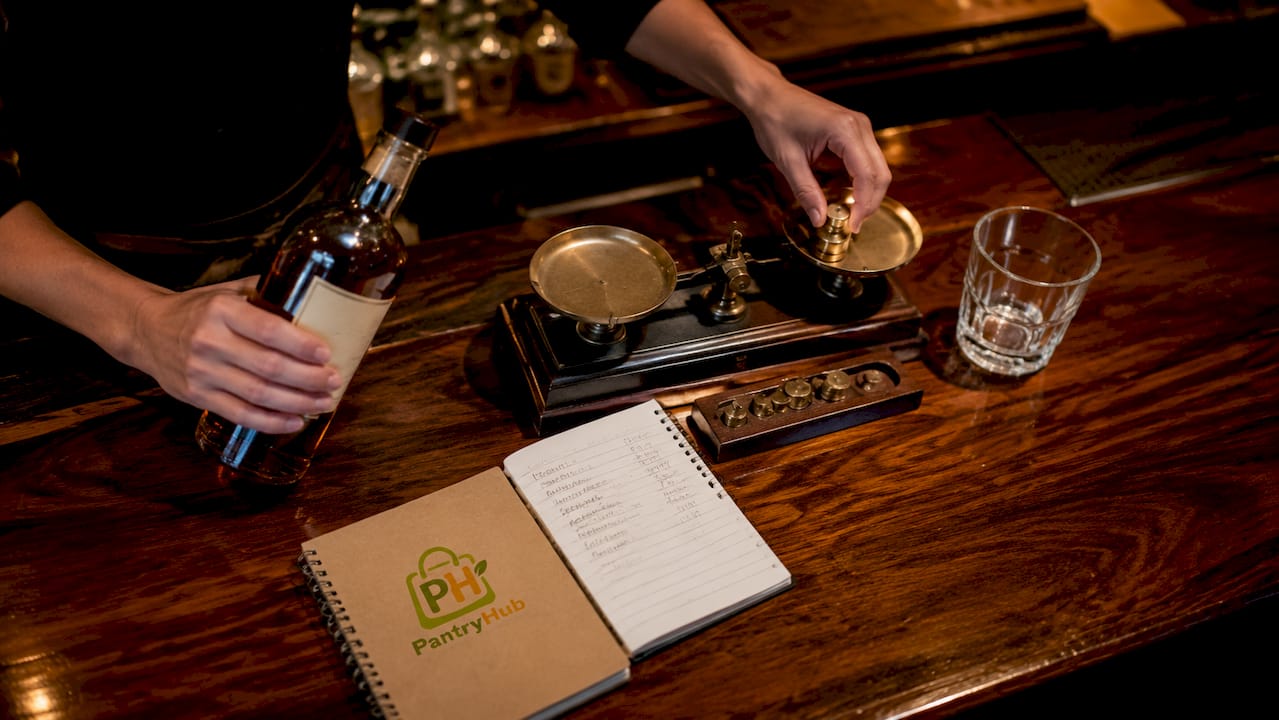
Counting full bottles is straightforward: one bottle equals one unit. The complexity begins with partials, and this is where most Adelaide bar stocktaking procedures break down. Inconsistent partial measurement is the single biggest source of data noise in manual counts.
The two accepted methods are weight-based and visual fraction-based. Weight-based counting uses a kitchen scale to weigh the partial bottle, subtract the tare weight of the empty container, and convert the remaining liquid weight to ounces or milliliters. Visual fraction counting divides each bottle into tenths and records the estimated fill level. Consistent partial measurement by the same person each cycle produces more reliable reports than switching between methods or counters.
For wine by the glass, track each opened bottle as a partial and record how many glasses have been poured against your standard pour size. For draft beer, measure keg volume either by weight on a keg scale or by reading the tap system's flow meter if one is installed. Using a consistent counting team and the same counting sequence each week produces data quality that is actually usable for corrective decisions.
Pro Tip: Label the tare weight of each bottle type on a reference card kept near your scale. This removes the need to look up empty weights mid-count and speeds up the process significantly.
3. Setting par levels and reorder points
Par levels are the minimum on-hand quantity for each product before a reorder is triggered. Setting them correctly is one of the most underrated stock control tips for bars, because a par level that is too high ties up cash in excess stock, while one that is too low creates service gaps during peak trade.
To set a par level, calculate your average weekly usage for each SKU over the past four to six weeks, then add a buffer based on your supplier lead time. If your McLaren Vale Shiraz sells 18 bottles per week and your supplier delivers twice weekly, a par of 12 to 14 bottles is reasonable. Review par levels monthly, not annually, because Adelaide's event calendar, including the Adelaide Fringe, WOMADelaide, and Tasting Australia, creates predictable demand spikes that require temporary par adjustments.
Separate your par levels by category. Spirits par levels should account for your top 10 to 15 SKUs by volume, while beer par levels need to factor in keg rotation and fridge capacity. Mixers and garnishes are often overlooked in bar inventory management but can cause service failures just as quickly as a depleted spirit line.
4. Tracking stock by category for precise loss investigation
Tracking beverage categories separately is what transforms a stock count from a compliance exercise into a diagnostic tool. When you combine all beverages into a single variance figure, a spirits loss can be masked by a beer surplus, and you will never find the source of the problem.
The four primary categories for any Adelaide bar inventory checklist template are spirits, beer (packaged and draft), wine (by bottle and by the glass), and non-alcoholic mixers and soft drinks. Within spirits, break down further by sub-category: whisky, vodka, gin, rum, and tequila each have different pour rates and price points, so their variance profiles differ. A 3% variance on a premium whisky line costs significantly more than a 3% variance on house vodka.
Once you have category-level data, you can cross-reference variance against shift reports. If your gin variance spikes on Friday nights, the problem is likely a specific shift or bartender, not a supplier discrepancy. This level of precision is only possible when your checklist separates categories from the start.
5. Manual versus software-assisted bar stocktaking
The choice between a manual checklist and a digital inventory platform is not purely about cost. It is about the volume of data you need to process and the speed at which you need to act on it.
| Factor | Manual checklist | Software-assisted (e.g., Pantryhub) |
|---|---|---|
| Setup cost | Near zero | Monthly subscription or license fee |
| Time per count | 2 to 4 hours | 45 to 90 minutes with mobile entry |
| Variance reporting | Manual calculation, error-prone | Automated, category-level reports |
| POS integration | None | Direct data sync with most POS systems |
| Scalability | Difficult across multiple locations | Built for multi-site management |
| Error rate | Higher, especially for partials | Lower with guided data entry |
Manual checklists work for very small venues with limited SKU counts and an owner who personally runs every count. For most Adelaide bars with 80-plus SKUs and multiple staff involved in counting, the manual approach produces data that is too slow and too inconsistent to act on reliably. Software like MarketMan automates theoretical versus actual usage comparison, and Pantryhub offers the same capability with features built specifically for Australian hospitality venues, including local supplier integration and multi-location visibility.
Pro Tip: Even if you use software, maintain a paper backup sheet for the first three months. It helps you catch data entry errors and builds staff confidence in the digital process before you rely on it fully.
6. How to reduce stock loss using checklist variance data
Inventory loss variance within 1 to 2% is generally manageable for a well-run bar. Anything above that threshold signals a problem that needs investigation, not just monitoring. Your checklist variance report is the starting point for every loss conversation.
The most direct loss reduction tools are mechanical pour controls. Jiggers reduce pour variance by 15 to 30% compared to free-pouring, which is a measurable, immediate improvement that costs almost nothing to implement. Speed pourers with measured inserts add another layer of control without slowing service. Require manager authorization for any comp or high-value giveaway, and record every comp in your POS so it appears in your theoretical usage calculation rather than showing up as unexplained variance.
"Inventory is not a passive task. It is an active management tool linking data to operational accountability." — Stop the Loss, 2026
Train your staff on pour specs using measured practice sessions, not just verbal instruction. When bartenders understand that the checklist catches over-pouring at the category level, behavior changes faster than it does with general reminders. Review and adjust par levels every four weeks based on actual sales trends, and use your variance reports to identify which categories or shifts need closer attention.
7. Building a repeatable weekly stocktaking procedure
A weekly inventory count with the same team, at the same time, following the same sequence is the foundation of effective bar inventory management. Frequency matters, but consistency matters more. A monthly count done perfectly is less useful than a weekly count done with moderate precision, because the corrective window is four times shorter.
Your weekly stocktaking procedure should follow this sequence:
- Pre-count setup: Print or open your count sheet, confirm all storage locations are accessible, and brief the counting team on any new products or location changes.
- Back bar and speed rail: Count all open and full bottles at the point of service first, recording partials with your chosen method.
- Walk-in cooler: Count all chilled stock including beer, wine, and pre-mixed products.
- Dry storage: Count all spirits, mixers, and non-alcoholic products in the main stock room.
- Keg room: Record keg weights or volume readings for all draft lines.
- Data entry: Enter all counts into your checklist template or software platform immediately after counting, while the data is fresh.
- Variance review: Compare actual usage to theoretical usage from your POS, flag any category exceeding 2% variance, and document the explanation before the next service.
Assign one person as the count lead and one as the recorder. Rotating both roles between counts introduces measurement inconsistency that compounds over time.
Key takeaways
Effective bar stock management in Adelaide depends on weekly counts, category-level tracking, consistent measurement, and variance analysis that connects inventory data to operational decisions.
| Point | Details |
|---|---|
| Weekly counts beat monthly counts | Weekly stocktaking produces a four-times-shorter corrective window for loss and variance issues. |
| Consistency beats precision in partials | The same person using the same method each cycle produces more reliable data than switching tools or counters. |
| Category separation enables diagnosis | Tracking spirits, beer, wine, and mixers separately lets you trace variance to a specific product line or shift. |
| Pour controls deliver measurable results | Jiggers and measured speed pourers reduce pour variance by 15 to 30%, cutting loss without operational disruption. |
| Software accelerates variance reporting | Digital platforms like Pantryhub automate the comparison between actual and theoretical usage, cutting count time nearly in half. |
What I've learned from watching bars get this wrong
Most Adelaide bar managers I've spoken with treat the stock count as a compliance task. They do it because they know they should, not because they trust the data it produces. That gap between going through the motions and actually using the data is where most inventory loss hides.
The most common failure I see is not skipping counts. It is inconsistency within counts. One week the owner counts, the next week a junior bartender counts, and the partial bottle method changes each time. The resulting variance figures are noise, not signal, and management stops trusting them. When management stops trusting the data, the checklist becomes theater.
The second failure is treating variance as a number to explain away rather than a problem to solve. A 4% spirits variance with a note saying "busy weekend" is not an explanation. It is a deferral. The bars that actually control their costs are the ones where the manager sits down after every count and asks which specific products drove the variance and why.
Technology helps, but it does not fix a culture problem. Pantryhub's bar inventory software will give you faster, cleaner data. It will not make your team care about the outcome. That part is still a management job. The checklist is the tool. Accountability is the practice.
— Admin
How Pantryhub supports your Adelaide bar stock management

Pantryhub is built specifically for Australian hospitality venues, and its bar inventory features are designed to replace the parts of your checklist that are most prone to human error. The platform connects directly to your POS, pulls theoretical usage automatically, and generates category-level variance reports after every count. You enter counts on a mobile device as you walk the bar, and the system flags any line item that exceeds your variance threshold before you finish the session.
For Adelaide bar managers running multiple locations or high-volume venues, Pantryhub's hospitality inventory software gives you real-time visibility across all sites from a single dashboard. Low-stock alerts, supplier ordering integration, and detailed reporting tools mean your checklist data becomes a live management tool rather than a weekly paperwork exercise. Explore Pantryhub's Adelaide inventory solutions to see how it fits your venue's specific needs.
FAQ
What is a bar stock management checklist?
A bar stock management checklist is a structured procedure for counting, measuring, and comparing all beverage inventory in a bar on a regular cycle, typically weekly. Its primary purpose is to generate variance data that identifies loss, over-pouring, and ordering inefficiencies.
How often should Adelaide bars do a full stocktake?
Weekly counts are the standard for bars that want timely variance data and a short corrective window. Monthly counts are too infrequent to catch pour control problems or theft before they compound into significant losses.
What is an acceptable inventory variance for a bar?
Variance within 1 to 2% of theoretical usage is generally considered manageable. Anything above 2% warrants a category-level investigation to identify whether the cause is over-pouring, theft, measurement error, or supplier discrepancy.
Should I use software or a manual checklist for bar inventory?
Manual checklists work for very small venues with under 50 SKUs and a single counter. For most Adelaide bars, software platforms like Pantryhub reduce count time, eliminate calculation errors, and produce automated variance reports that a spreadsheet cannot match at scale. You can find a detailed comparison in this bar stocktake guide for Australian venues.
How do I measure partial bottles accurately during a stocktake?
Use a kitchen scale to weigh the partial, subtract the empty bottle's tare weight, and convert to your unit of measure. If you prefer visual fractions, divide each bottle into tenths and record consistently. The key rule: the same person using the same method every count cycle produces far more reliable data than any single measurement tool.